Cloud Compliance Dashboard
Overview
This dashboard provides a consolidated view of your compliance across all cloud providers that are integrated with Lacework.
To go to the Cloud Compliance Dashboard in the Lacework Console, click Compliance > Cloud.
To populate the data viewed in this page, you must configure at least one integration to a cloud provider. For more information, see:
Terminology
The Cloud Compliance dashboard uses terminology that differs from variations used in the AWS, Azure, or GCP Compliance Dashboard and Reports pages.
The table below provides comparative guidance on these terminologies:
| AWS / Azure / GCP Compliance Dashboard & Reports | Cloud Compliance Dashboard |
|---|---|
| Recommendation Policy Assessment Assessment | Policy |
| Benchmark Report Type Report | Assessment |
| Violated In-violation Failed Non-compliant | Resources: Fail Policies: Non-compliant |
| Compliant Passed | Resources: Pass Policies: Compliant |
| AWS: Accounts Azure: Tenants and Subscriptions GCP: Organizations and Projects | Accounts |
| Assessed Monitored Analyzed | Assessed |
| Suppressed | Exception |
See Groups and Filters for descriptions of the elements within the Cloud Compliance dashboard.
Groups
By default, the Compliance list displays assessments. Change what group the list displays by selecting a different Group by option from the drop-down:
| Group | Description |
|---|---|
| Policy | Displays all policies in the Compliance list (both custom and default). |
| Assessment (default) | Displays all assessments such as CIS Benchmark reports in the Compliance list. |
| Account | Displays all integrated cloud accounts. |
Filters
Use the following methods to refine what is displayed in the compliance list:
- Use the search function at the top of the page to find specific text in any of the details available on the page. You can also click the search field to select values and operators to narrow your search.
- Click the filter dropdowns along the top of the page and check the boxes to make them active. Click an active filter to remove it or click Reset. You can also click on the tags in the table list to use them as filters.
The available filters change depending on what Group by option you have selected:
| Filter | Groups | Description |
|---|---|---|
| Severity | Group by Policy | Display policies for the specified severity (for example: Critical). |
| Provider | All | Display compliance details for the specified provider: AWS, Azure, or GCP. |
| Status | Group by Policy | Display policies with the specified status (for example: Non-compliant). |
| Report | Group by Policy | Display policies for a specified report (for example: GCP PCI Benchmark). |
| Account | All | Display compliance details for a specified integrated cloud account (for example: Organization: 123456789101). |
| Any field | All | Display results that include a specified value. |
Date
To change the assessment date, click Custom from the drop-down, then select a date from the calendar. After a custom date is selected, use the horizontal arrows to move to the next/previous day.
Only information found during assessment on the specified date is reported. For example, if a number of resources were only integrated with Lacework yesterday, the total number of resources shown in the report 7 days ago would differ from the number shown in today's report.
Save View
When the page displays your selected group and filters, save the current view by clicking the Save view icon in the top right corner. This lets you access the saved view later through the Open view icon.
When you open a saved view, its name displays in the page title as Cloud compliance / name. Click the pencil icon adjacent to this name to duplicate or delete the view.
You can also click the Copy link icon to copy the link to the current view. You can then share that link with others, so they can see the same view.
note
Searches and sorting cannot be saved in views or copied as links.
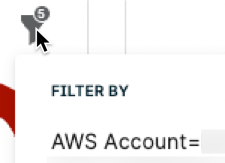
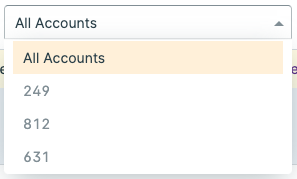
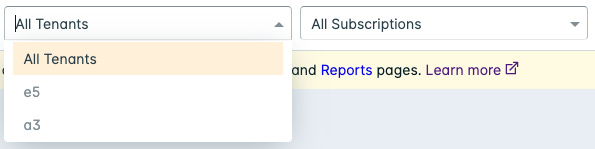
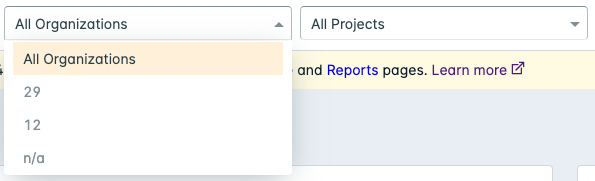
Visible Accounts
Use the AWS Account, Azure Subscription, and GCP Project dropdowns to filter your Compliance results to specific cloud provider accounts.

Each cloud provider has a dropdown and all integrated accounts are listed within. Use the search bar to find a specific account (or subset). Check the boxes to change whether Compliance details are displayed for that account, then click Show Results.
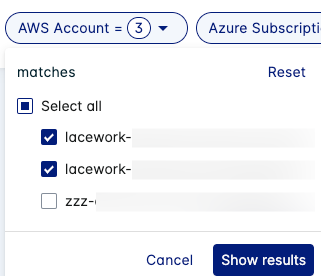
info
The number of visible accounts is limited to 100 per cloud provider.
Google Apps Script Projects are hidden by default. Contact Lacework Support if you want to enable visibility of these projects.
On-Demand Compliance Scans
Use on-demand compliance scans to reassess compliance policies, violation alerts, and reports for your chosen cloud service provider.
When using this feature, a resource management collection is made for all integrated cloud accounts within the chosen cloud service provider (such as projects and organizations for GCP, tenants and subscriptions for Azure, or accounts for AWS). Reports are then regenerated using the new data.
info
Scans take 1-2 hours to complete on average. Only one scan can be active at a time per integration.
Run an On-Demand Scan
Click Open adhoc scanning options in the top right corner to view available options:

Check the cloud service provider that you want to reassess and click Scan now:
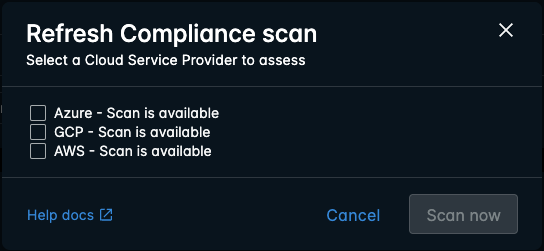
The cloud service provider option is unselectable if a scan completed within the last hour, or if a scan is currently ongoing.
Once the scan is complete, the Report last run times are updated for assessments, accounts, and services. This includes the reports on the Reports page.
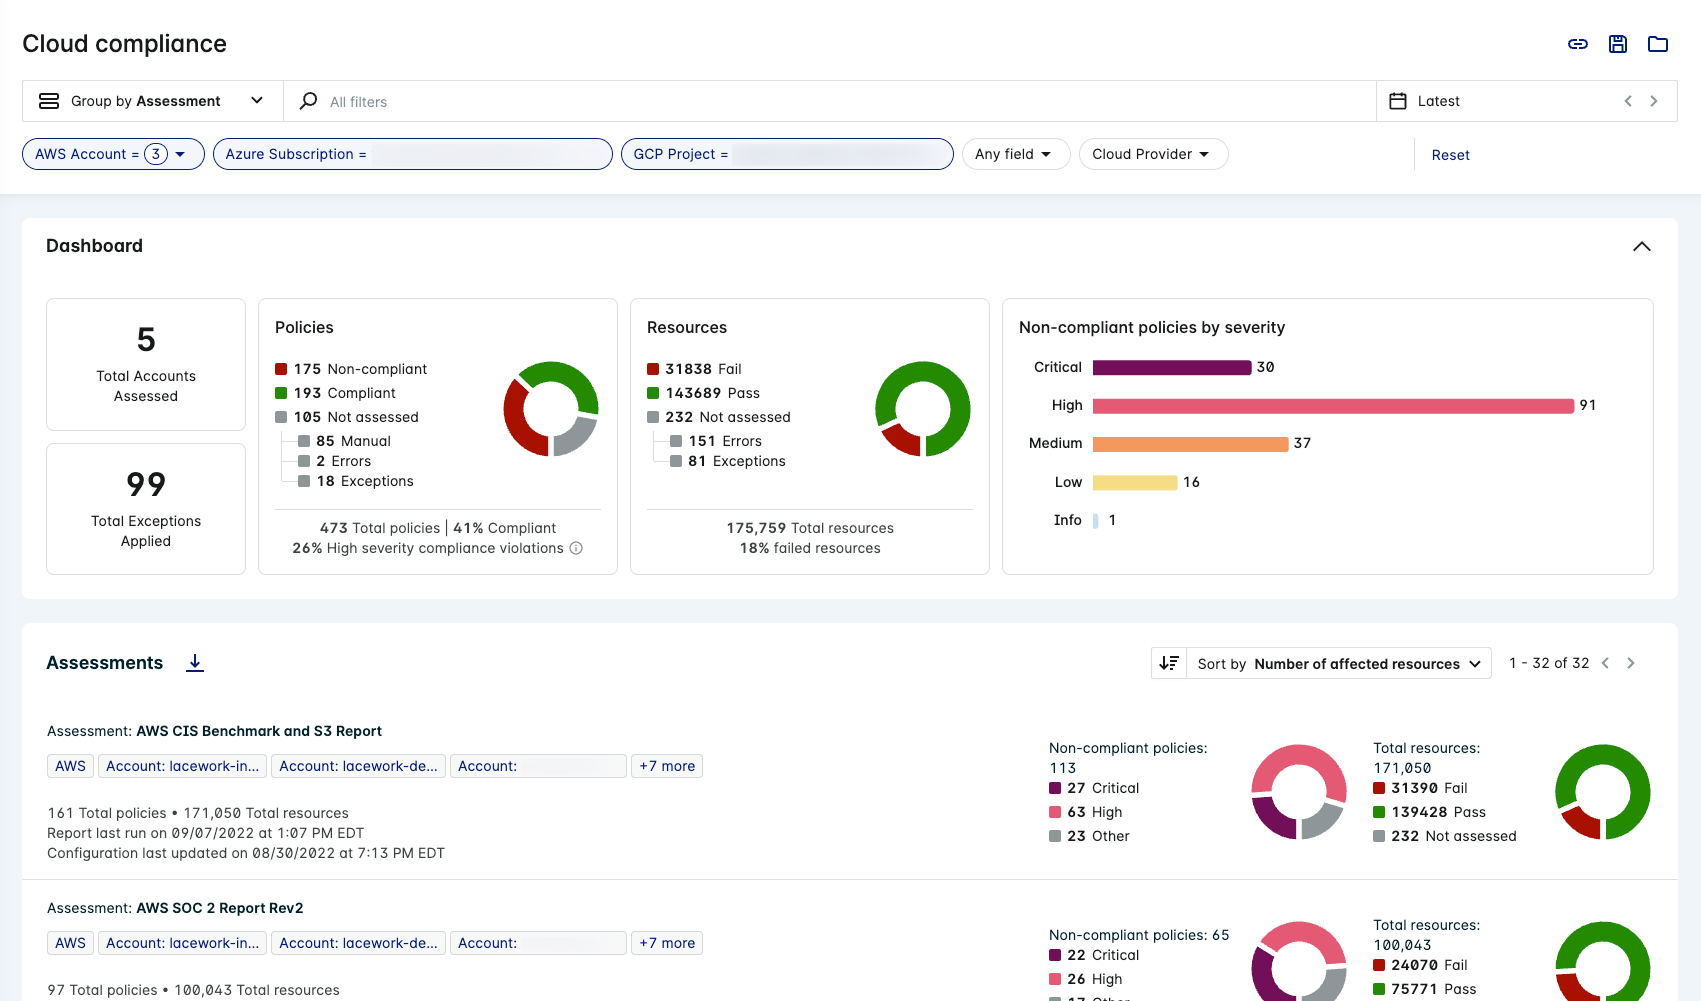
Charts
Dashboard Charts
The Cloud Compliance dashboard contains a number of statistics and charts to help visualize your security posture.
important
All charts and statistics actively update to the group, search, and/or filters that you apply to the page.
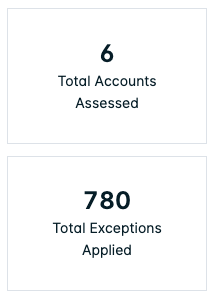
Statistics
The statistics display the number of integrated cloud accounts that have been assessed, and the total number of exceptions applied across policies.
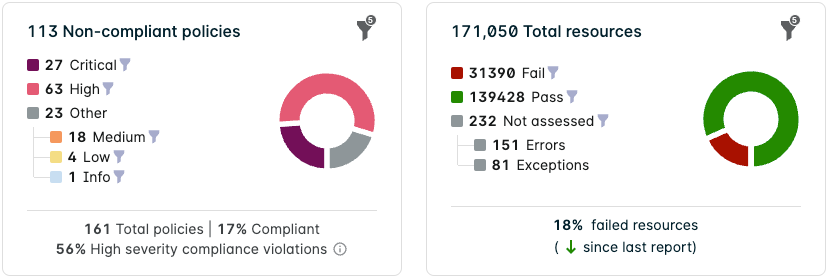
Policies
The Policies chart displays the total number of policies and splits them into the following categories:
- Policies that are non-compliant when integrated resources were assessed.
- Policies that are compliant when integrated resources were assessed.
- Policies that have not been assessed due to the following reasons:
- Policies that require manual auditing.
- Policies that were not assessed due to an error.
- Policies that have exceptions applied to them.
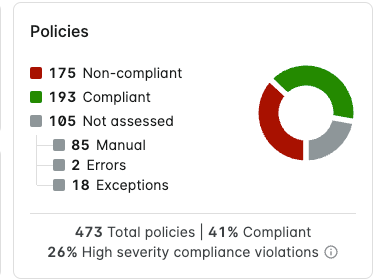
note
The percentage of high severity compliance violations include critical and high severity violations.
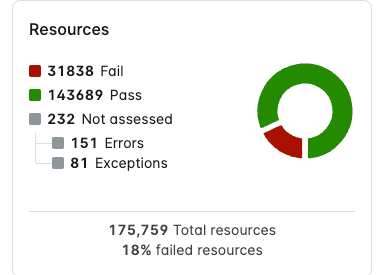
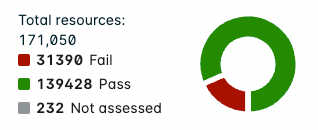
Resources
The Resources chart displays the total number of resources and splits them into the following categories:
- Resources that are non-compliant due to failing a policy assessment (or multiple policy assessments).
- Resources that are compliant due to passing policy assessments.
- Resources that have not been assessed due to the following reasons:
- Resources that were not assessed due to an error.
- Resources that have exceptions applied to them.
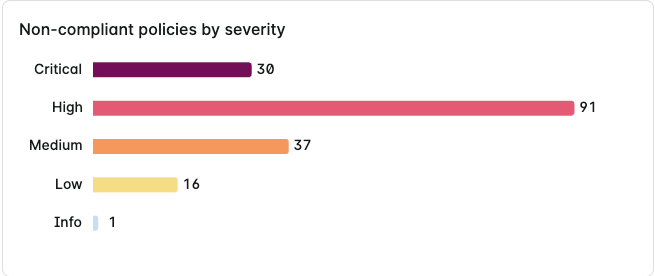
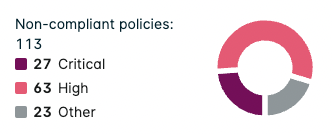
Non-compliant policies by severity
This chart splits non-compliant policies into severity levels of Critical, High, Medium, Low, and Info.
Compliance List Charts
Each row in the Compliance list has a chart (or charts) associated to that assessment, policy, account, or service. The list displays different chart(s) depending on what group is selected.
Group by Policy Chart
When Group by Policy is selected, the chart displays the total number of resources linked with that policy and splits them into the following categories:
- Resources that are non-compliant due to failing the policy assessment.
- Resources that are compliant due to passing the policy assessment.
- Resources that were not assessed due to errors or exceptions.

Policy Drawer Chart
Click a policy in the Compliance list to display a drawer with the same chart with additional statistics:
- Total number of exceptions as of the last reported date and time.
Click View exceptions to see a detailed list of the exceptions applied to the policy.
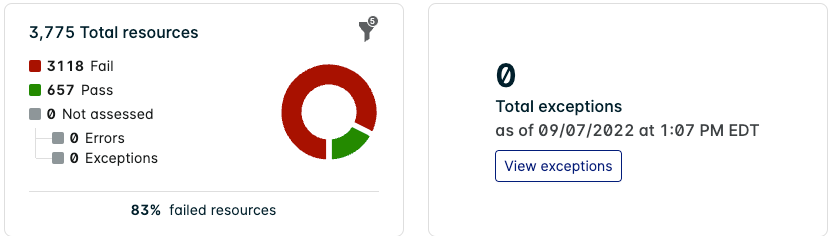
Hover over the filter icon to see the active filters influencing the chart.
Group by Assessment/Account Charts
When Group by Assessment/Account is selected, the chart displays the total number of non-compliant policies for that assessment/service/account and splits them into severity levels of Critical, High, or Other (being Medium, Low, and Info combined).
Additionally, another chart displays the total number of resources linked with the policy and splits them into the following categories:
- Resources that are non-compliant due to failing the policy assessment.
- Resources that are compliant due to passing the policy assessment.
- Resources that have not been assessed due to errors or exceptions.
Assessment/Account Drawer Charts
Click an assessment/account in the Compliance list to display a drawer with the same charts with added statistics:
- Total number of policies associated with the assessment/account.
- Percentage of compliant policies associated with the assessment/account.
- Percentage of high severity compliance violations.
- In this case, high severity includes both critical and high severity compliance violations.
- Percentage of resources that have failed one or more policy assessments. The arrow also signifies whether the amount of resources failing policy assessments has increased or decreased since the last report.
Hover over the filter icon to see the active filters that are influencing the charts.
Click on the filter icon  for a severity level to apply the filter to the table below.
Compliance List
The Compliance list is below the statistics and charts. Each row displays an individual policy, assessment, service, or account depending on what group is selected.
The Compliance list allows you to Download CSV and sort.
Click a tag to reload the Compliance list using the tag as the filter.
Group by Policy
When Group by Policy is selected, the Sort by options can order the list by:
- Number of affected resources
- Policy name
- Level of severity
Each row displays compliance details on an individual policy. For example, Ensure access keys are rotated every 90 days or less.
Policy Drawer
Click a policy row to display detailed policy results (click the < icon to expand this to full screen).
tip
For policies associated with a benchmark rule, click View context (if available) underneath the policy title to see detailed information about the benchmark rule.
The policy drawer shows information underneath the title about when the policy assessment was last updated and the most relevant tags associated with the policy.
Underneath the chart, the table displays Failed resources associated with the policy.
![]()
Click the icons to download the table as a CSV, select columns, and search for specific text in any of the column details.
The table has the following information in each column:
| Column | Description |
|---|---|
| Resource | Each row displays an individual resource that has failed the policy assessment. |
| Region | If applicable, the cloud region of the resource (example: us-west-2). |
| Status | The status of the assessment. This could be either Non-compliant, Could Not Assess, or Exception. Lacework does not list resources that are compliant. |
| Account | The cloud account associated with the resource. |
| Click to see additional options for the resource. |
Add Compliance Exceptions
Click the additional options button ![]() to add a compliance exception for the resource and policy selected.
to add a compliance exception for the resource and policy selected.
Group by Assessment
When Group by Assessment is selected, the Sort by options can order the list by:
- Number of affected resources
- Number of affected policies
- Report name
Each row displays compliance details on an individual assessment report. For example, Lacework AWS Security Addendum 1.0.
Assessment Drawer
Click an assessment row to display detailed assessment report results (click the < icon to expand this to full screen).
Underneath the title, the assessment drawer displays information about when the report last ran, when the configuration was last updated, and who last updated it. For assessments on a single account, click View report for more information and to download it as a PDF. The most relevant tags to this particular assessment are also displayed.
Underneath the charts, there are two tab options to display Policies or Resources associated with the assessment report.
Policies Tab for Assessments
Select the Impacted policies by section subtab to view policies within their associated section (such as Identity and Access Management).

Click the icons to view and enable Severity and Status filters, and search for specific text in any of the column details.Select the All impacted policies subtab to view all policies associated with the assessment report.

Click the icons to download the table as a CSV, select columns, view and enable Severity and Status filters, and search for specific text in any of the column details.
The tables have the following information in each column:
| Column | Description |
|---|---|
| Control ID | Displays the unique identifier for the recommendation. This often corresponds to the CIS Benchmark rule ID that is used for CIS Benchmark reports. |
| Policy name | Each row displays an individual policy associated with the assessment report. Click a policy name to view the policy assessment details. |
| Resources | The number of resources that have passed or failed the policy assessment. Click on the expand icon Click View failed resources in resources tab to switch to the Failed resources tab with the associated policy selected as a filter. |
| Status | The overall compliant status for the policy. One or more resources failing the policy assessment triggers the non-compliant status for the policy. |
| Severity | The severity level of the policy. |
| Number of exceptions (hidden by default) | The number of compliance policy exceptions applied to this policy. |
Resources Tab for Assessments
- Select the Failed resources subtab to view all failed resources associated with the assessment report. A resource is defined as failed if it is non-compliant with at least one policy during the last compliance assessment.
- Select the Excluded resources subtab to view any resources that have a compliance policy exception applied to them.
![]()
Click the icons to download the table as a CSV, select columns, view and enable Policy filters, and search for specific text in any of the column details.
The tables have the following information in each column:
| Column | Description |
|---|---|
| Resource | The Lacework ARN for the resource. Failed resources: Each row displays an individual resource that has failed one or more policy assessments. Excluded resources: Each row displays an individual resource that has been excluded from one or more policy assessments. |
| Region | If applicable, the cloud region of the resource (example: us-west-2). |
| Account | The cloud account associated with the resource. |
| Provider (hidden by default) | The cloud service provider for the resource. |
| Status | The overall compliant status for the resource. One or more policy failures triggers the non-compliant status for the resource. |
| Impacted policies | The number of policies triggering a non-compliant status for the resource. Click on the expand icon |
Group by Account
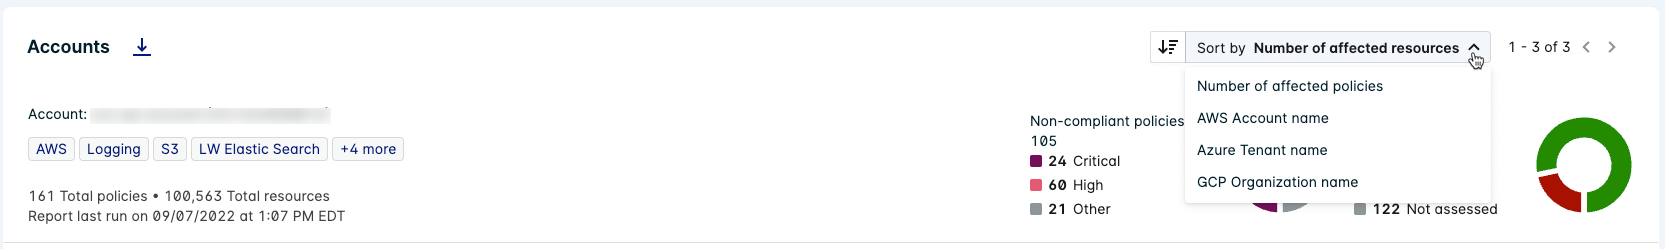
When Group by Account is selected, the Sort by options can order the list by:
- Number of affected resources
- Number of affected policies
- AWS Account name
- Azure Tenant name
- GCP Organization name
Each row displays compliance details on an individual cloud provider account. For example, if it's an Azure cloud account, details are displayed for a Subscription in a given Tenant.
Account Drawer
Click an account row to display detailed account results (click the < icon to expand this to full screen).
The account drawer shows information underneath the title about when the account assessment was last updated and the most relevant tags.
Underneath the charts, there are two tab options to display Policies or Resources associated with the account.
Policies Tab for Accounts
![]()
Click the icons to download the table as a CSV, select columns, view and enable Severity and Status filters, and search for specific text in any of the column details.
The table has the following information in each column:
| Column | Description |
|---|---|
| Control ID | Displays the unique identifier for the recommendation. This often corresponds to the CIS Benchmark rule ID that is used for CIS Benchmark reports. |
| Policy name | Each row displays an individual policy associated with the account. Click a policy name to view the policy assessment details. |
| Resources | The number of resources that have passed or failed the policy assessment. Click on the expand icon Click View failed resources in resources tab to switch to the Failed resources tab with the associated policy selected as a filter. |
| Status | The overall compliant status for the policy. One or more resources failing the policy assessment triggers the non-compliant status for the policy. |
| Severity | The severity level of the policy. |
| Number of exceptions (hidden by default) | The number of compliance policy exceptions applied to this policy. |
Resources Tab for Accounts
- Select the Failed resources subtab to view all failed resources associated with the account. A resource is defined as failed if it is non-compliant with at least one policy during the last compliance assessment.
- Select the Excluded resources subtab to view any resources that have a compliance policy exception applied to them.
![]()
Click the icons to download the table as a CSV, select columns, view and enable Policy filters, and search for specific text in any of the column details.
The tables have the following information in each column:
| Column | Description |
|---|---|
| Resource | The Lacework ARN for the resource. Failed resources: Each row displays an individual resource that has failed one or more policy assessments. Excluded resources: Each row displays an individual resource that has been excluded from one or more policy assessments. |
| Region | If applicable, the cloud region of the resource (example: us-west-2). |
| Account | The cloud account associated with the resource. |
| Provider (hidden by default) | The cloud service provider for the resource. |
| Status | The overall compliant status for the resource. One or more policy failures triggers the non-compliant status for the resource. |
| Impacted policies | The number of policies triggering a non-compliant status for the resource. Click on the expand icon |
Determination of the Could Not Assess Status
In order to assess resources for compliance, Lacework must collect data for each resource. Lacework uses the data collection status to determine which policies have a sufficient amount of quality information to be evaluated, even if there is information for only some resources. An issue collecting data could cause the status to be returned as Could not assess.
Some issues that Lacework could encounter when collecting data include the following:
- Transient failures, for example: rate limits and timeouts.
- Incorrect permissions used by the Lacework collector, which were provided during role setup for the integration.
The assess functionality converts a recognition of the many potential problems into the Could not assess result.
Lacework applies the following process to determine if a policy’s status is Could not assess:
- At a resource level:
- If Lacework can determine non-compliance, then the resource is “non-compliant”.
- Else, if Lacework cannot determine non-compliance, and the resource was not successfully fully collected, the resource is Could not assess.
- Else, if Lacework can determine that there is no non-compliance, or sufficient conditions for compliance, the resource is “compliant”.
- Lacework aggregates resource-level compliance observations and determines the aggregate status for the cloud integration as follows:
- Non-compliant if any resources are known to be non-compliant.
- Could not assess if no resources are non-compliant, but some resource evaluations were Could not assess.
- Compliant if all resources are known to be compliant.
The overall goal of Lacework is to never report a resource as compliant if it is not. Policy queries need adequately reliable information to determine non-compliance, and the methodology used is biased towards determining non-compliance, not compliance. It is possible for Lacework to determine a collection to be Could not assess and a policy using that collection in some way to be non-compliant. The granularity of assessment capability will be refined in later releases.
Use Cases for Cloud Compliance Dashboard
The following sections show how to use the Cloud Compliance Dashboard to view different types of information.
If applicable, they also specify where similar information was found in the deprecated Compliance pages for AWS, Azure, and GCP.
Select a Cloud Provider and View Compliance Details
- In the Cloud Provider drop-down, check the boxes of the Provider(s) that you want to display Compliance details for (for example: Azure) then click Show results.
- The Compliance details for the chosen cloud provider are displayed. The details vary depending on which Group by option is selected.
Deprecated Method
This method replaces the following deprecated Console pages:
Compliance > AWS / Azure / GCP

Select a Cloud Account and View Compliance Details
- Use the cloud provider-specific drop-downs (for example, Azure Subscription) to select the boxes for the Account(s) that you want to display Compliance details for, (for example: Organization: [organization name] and Project: [project name]) then click Show results.
- The Compliance details for the chosen account are displayed. The details vary depending on which Group by option is selected.
Deprecated Method
This method replaces the following deprecated Console pages and dropdown options:
Compliance > AWS / Azure / GCP > Dashboard / Reports
- Any Account, Tenant, Subscription, Organization, or Project dropdown.
View Compliance Summary of a Cloud Account
Select Group by Account to view a Compliance summary for each cloud account integrated with Lacework.
(Optional) In the Cloud Provider drop-down, check the boxes of the Provider(s) that you want to display Compliance details for (for example: Azure) then click Show results.
Use the Sort by dropdown to specify the order of the Accounts list.
Click an Account to view more details in the Account Drawer.
Deprecated Method
This method replaces the following deprecated Console pages and sections:
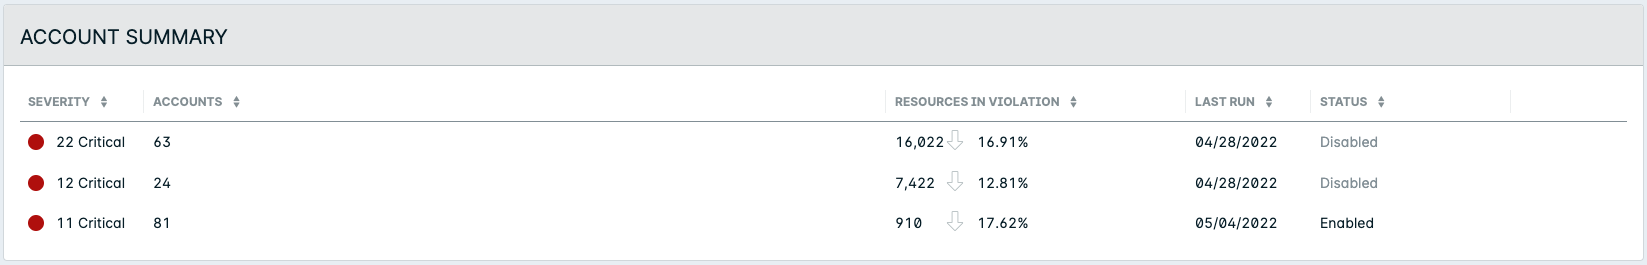
Compliance > AWS > Dashboard > Account Summary
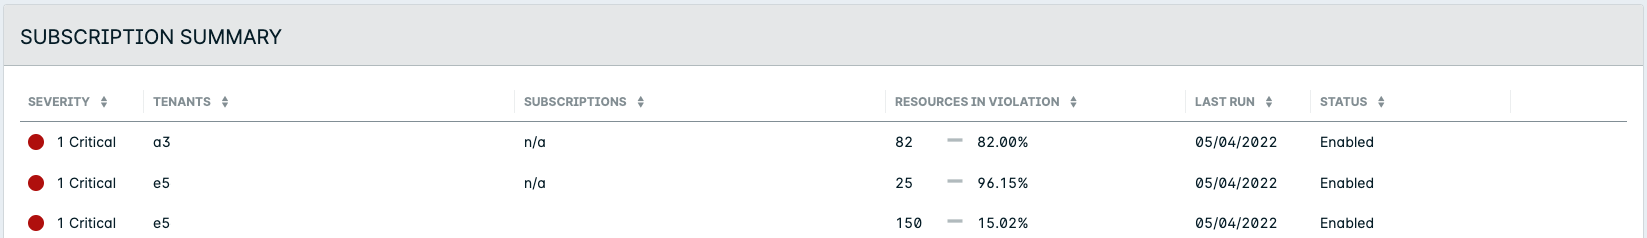
Compliance > Azure > Dashboard > Subscription Summary
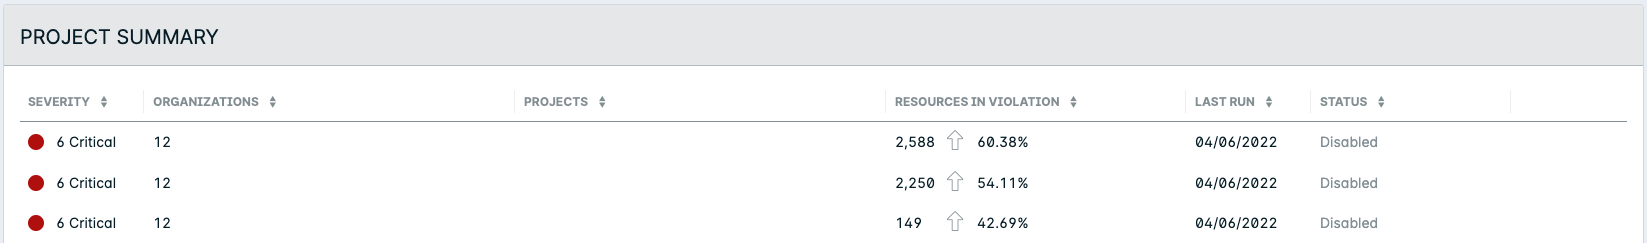
Compliance > GCP > Dashboard > Project Summary
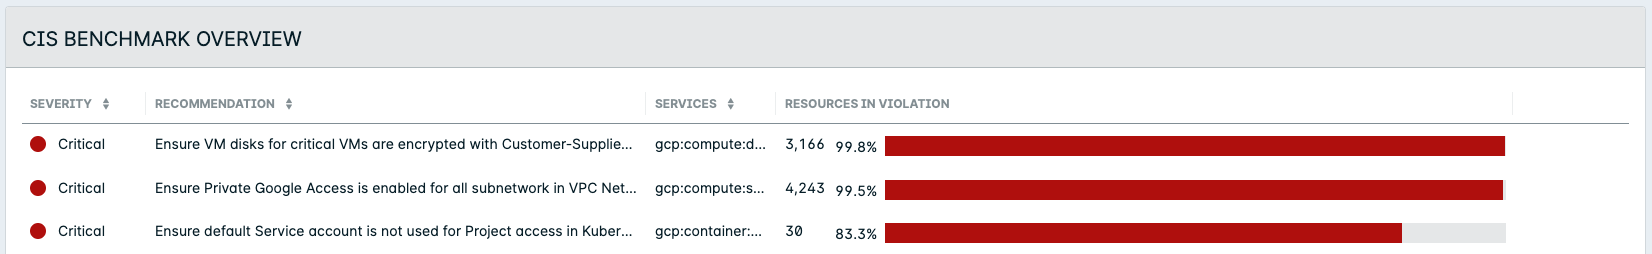
View CIS Benchmark Report Overview
Select Group by Assessment to view a Compliance summary for each CIS Benchmark report.
(Optional) Use the cloud provider-specific account drop-downs to select a specific account (for example: Tenant: [tenant name] and Subscription: [subscription name]).
Use the Sort by dropdown to specify the order of the Assessments list.
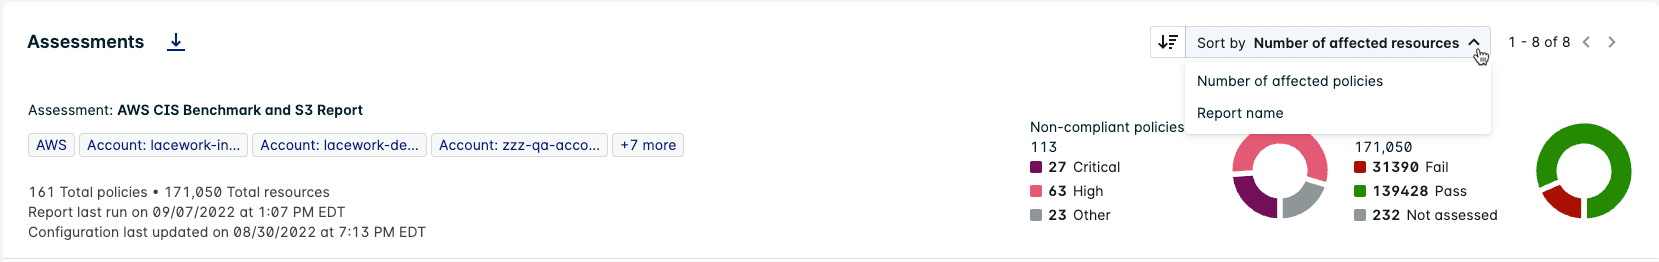
Click an Assessment to view more details in the Assessment Drawer.
Deprecated Method
This method replaces the following deprecated Console pages and sections:
Compliance > AWS / Azure / GCP > Dashboard > CIS Benchmark Overview
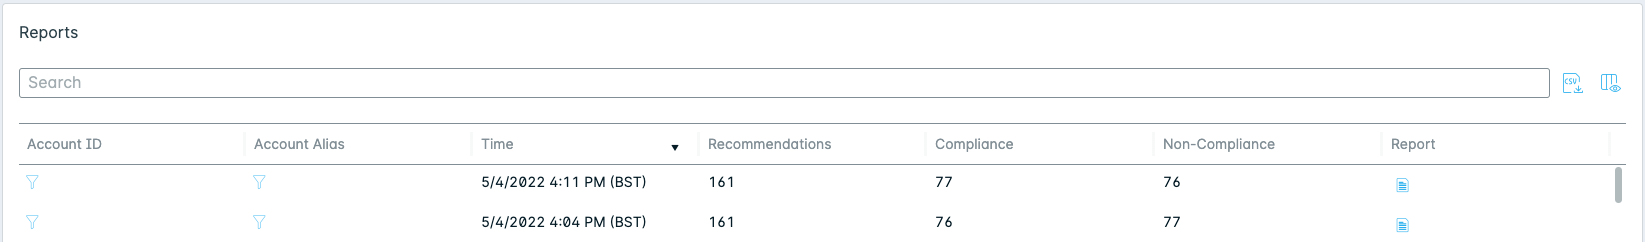
Compliance > AWS > Summary > Reports
- Use the Reports page to download and view CIS Benchmark reports.
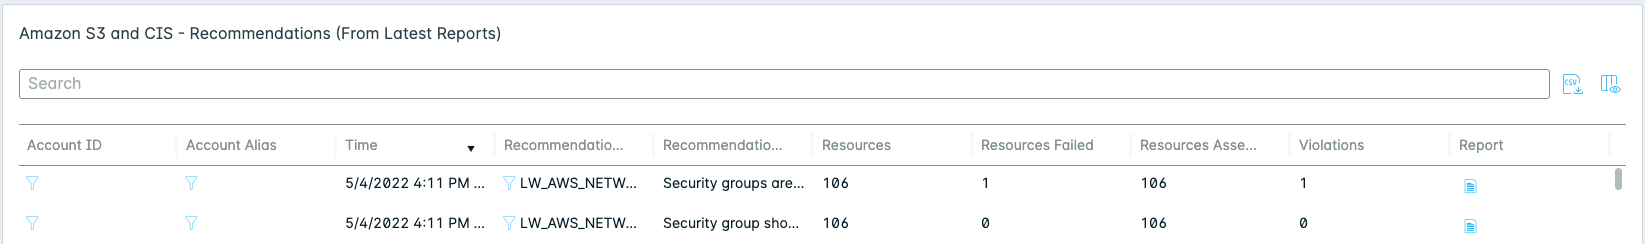
View Policy Assessments for a CIS Benchmark Report
- Select Group by Policy to view individual policy assessments for all your integrated resources.
- Click Show more in the row of filters, then select the report that you want to view (for example: Azure CIS Benchmark) in the Report drop-down. Policies that apply to the selected report are shown.
- (Optional) To view the Benchmark report for a specific account, use the cloud provider-specific account drop-downs to select a specific account (for example: Tenant: [tenant name] and Subscription: [subscription name]).
- (Optional) The latest assessment is shown by default. Change the date to view past assessments.
- Click an Assessment to view more details in the Assessment Drawer. The assessment results for the CIS Benchmark policies are contained within.
tip
Use the Reports page to view and download CIS Benchmark reports.
Deprecated Method
This method replaces the following deprecated Console pages and sections:
Compliance > AWS > Summary > Amazon S3 and CIS - Recommendations (From Latest Reports)
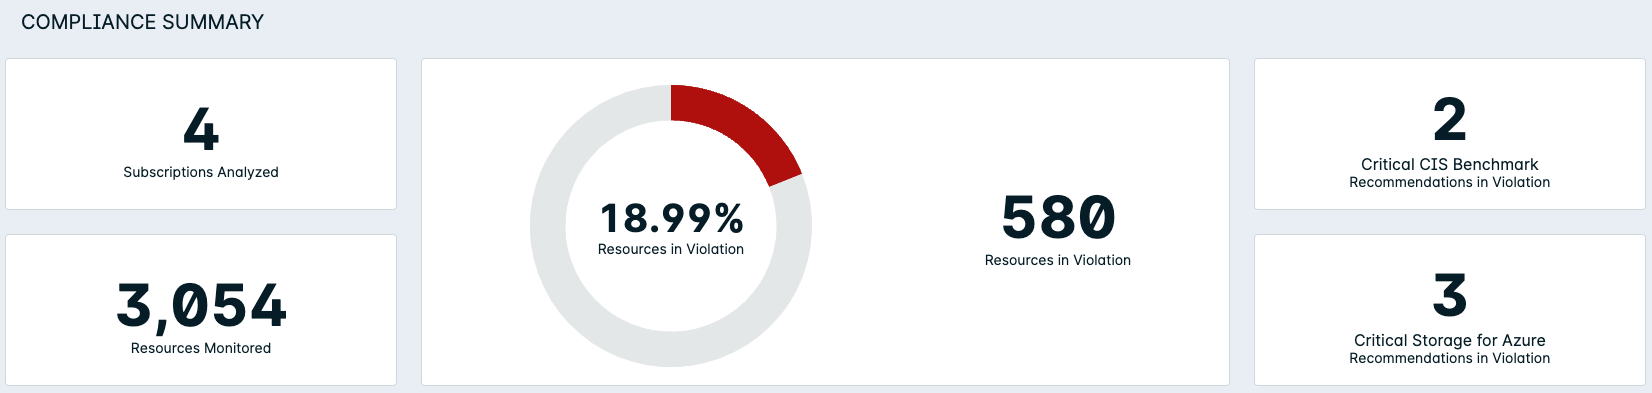
View Compliance KPIs and Data Visualizations for a Benchmark Report
- Click Show more in the row of filters, then select the report that you want to view (for example: Azure CIS Benchmark) in the Report drop-down. Policies that apply to the selected report are shown.
- (Optional) To view the Benchmark report for a specific account, use the cloud provider-specific account drop-downs to select a specific account (for example: Tenant: [tenant name] and Subscription: [subscription name]).
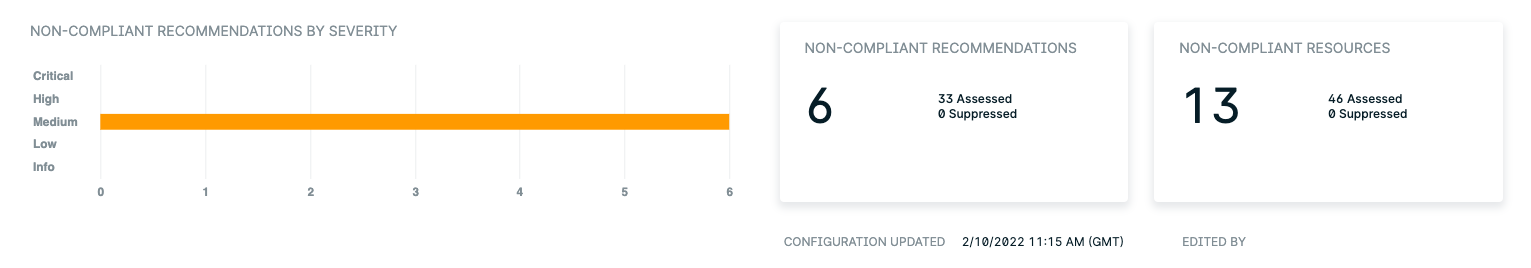
- View the Dashboard Charts at the top to see a visual summary of important statistics and KPIs relating to the Benchmark report on the specified account.
Deprecated Method
This method replaces the following deprecated Console pages and sections:
Compliance > AWS / Azure / GCP > Dashboard > Compliance Summary
Compliance > AWS / Azure / GCP > Reports > Non-Compliant Recommendations / Resources / By Severity
View and Add Exceptions on a Policy
Select Group by Policy to view individual policy assessments.
Under filters, select the Report that you want to view (for example: Azure CIS Benchmark). Policies that apply to the selected report are shown.
(Optional) View policy assessments for a specific account by using the Account filter (for example: Organization: [organization name] and Project: [project name]).
(Optional) The latest assessment is shown by default. Change the date to view past assessments.
Click a Policy to view more details in the Policy Drawer. The assessment results display the total number of exceptions applied to the policy.
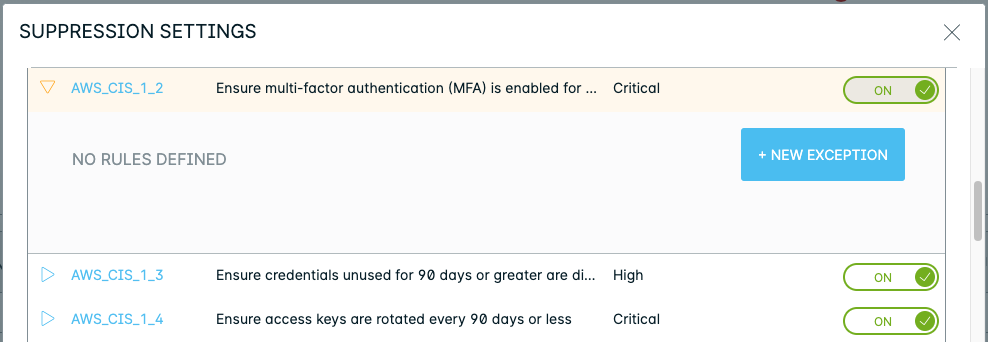
Click View exceptions to see details of each exception. You can also add new exceptions here.
tip
You can also add exceptions through the Policies page.
Deprecated Method
This method replaces the following deprecated Console pages and options:
Compliance > AWS / Azure / GCP > Reports > Recommendation Actions > Advanced Suppression
Add Exceptions for a Specific Resource on a Policy
If you want to add an exception for a resource listed in the Policy Drawer table, click the additional options button
 for the resource.
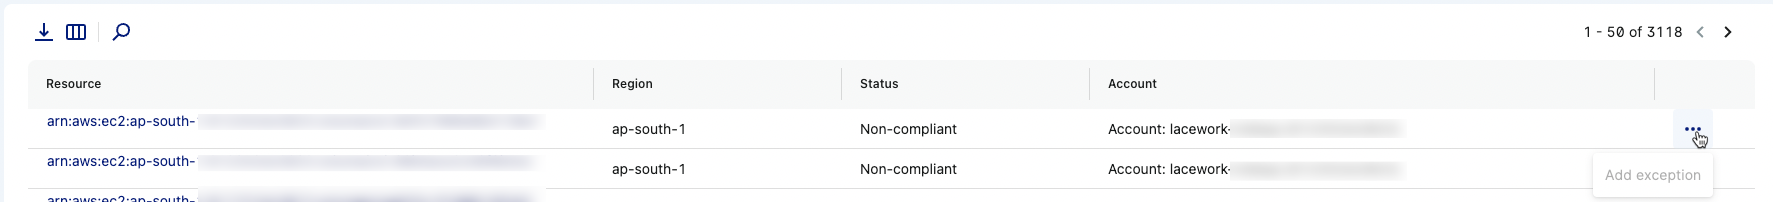
Click Add exception to enter the Exceptions tab for the policy. The Key Id/Alias is filled with the resource you selected.
View Critical and Non-Compliant Policies
- Select Group by Policy to view individual policy assessments for all your integrated resources.
- Click the Severity drop-down filter and select Critical, then click Show results.
- Click the Status drop-down filter and select Non-compliant, then click Show results.