Kubernetes Compliance Dashboard
Overview
This dashboard provides a consolidated view of your compliance across all Kubernetes clusters that are integrated with Lacework.
To go to the Kubernetes Compliance Dashboard in the Lacework Console, click Compliance > Kubernetes.
To populate the data viewed in this page, you must configure at least one integration to a Kubernetes cluster. For more information, see Kubernetes.
Groups
By default, the Compliance list displays policies. Change what group the list displays by selecting a different Group by option from the drop-down:
| Group | Description |
|---|---|
| Account | Displays all integrated cloud accounts. |
| Assessment | Displays all assessments such as CIS Benchmark reports in the Compliance list. |
| Cluster | Displays all integrated Kubernetes clusters. |
| Policy | Displays all policies in the Compliance list (both custom and default). |
| Section | Displays all Lacework Kubernetes Compliance sections (some of these are derived from CIS Benchmark sections, such as Worker Nodes). |
Filters
Use the following methods to refine what is displayed in the compliance list:
All filters - use the search function at the top of the page to find specific text in any of the filters available on the page.
Click filters within the dropdowns along the top of the page to make them active. Remove an active filter by clicking on it again or by clicking the Reset option.
You can also click on the tags in the table list to use them as filters.
The available filters change depending on what Group by option you have selected:
| Filter | Groups | Description |
|---|---|---|
| Severity | Group by Policy | Display policy assessments with the specified severity (for example: Critical). |
| Status | Group by Policy | Display policy assessments with the specified status (for example: Non-compliant). NOTE: Suppressed is when a policy has an exception applied to it. |
| Cloud Provider | All | Display compliance details for Kubernetes clusters from a specified provider: AWS, Azure, or GCP. |
| Domain | Group by Policy | Display policy assessments for Kubernetes clusters in the specified domains. |
| Cluster | Group by Account | Display compliance details for the specified Kubernetes cluster names. |
| Group by Assessment | ||
| Group by Policy | ||
| Group by Section | ||
| Cluster Type | Group by Cluster | Filter the Kubernetes clusters displayed by type (for example: EKS). |
| Cluster Status | Group by Cluster | Filter Kubernetes clusters by the level of Compliance data received: Full collection - All the necessary Compliance data has been received for the cluster. Partial collection - Either Node Collector or Cluster Collector data is not available for the cluster. See Kubernetes Compliance - FAQs for more information. |
| Region | Group by Account | Display compliance details for Kubernetes clusters in the specified cloud provider regions (for example: eu-west-1). |
| Group by Assessment | ||
| Group by Cluster | ||
| Group by Section | ||
| Account | Group by Assessment | Display compliance details for Kubernetes clusters in a specified integrated cloud account (for example: 123456789101). |
| Group by Cluster | ||
| Group by Section | ||
| Namespace | Group by Cluster | Filter the Kubernetes clusters displayed by namespace (for example: default). |
Date
To change the assessment date, select a custom date from the drop-down or use the horizontal arrows to move to the next/previous day.
Only information found during assessment on the specified date is reported. For example, if a number of resources were only integrated with Lacework yesterday, the total number of resources shown in the report 7 days ago would differ from the number shown in today's report.
Charts
Dashboard Charts
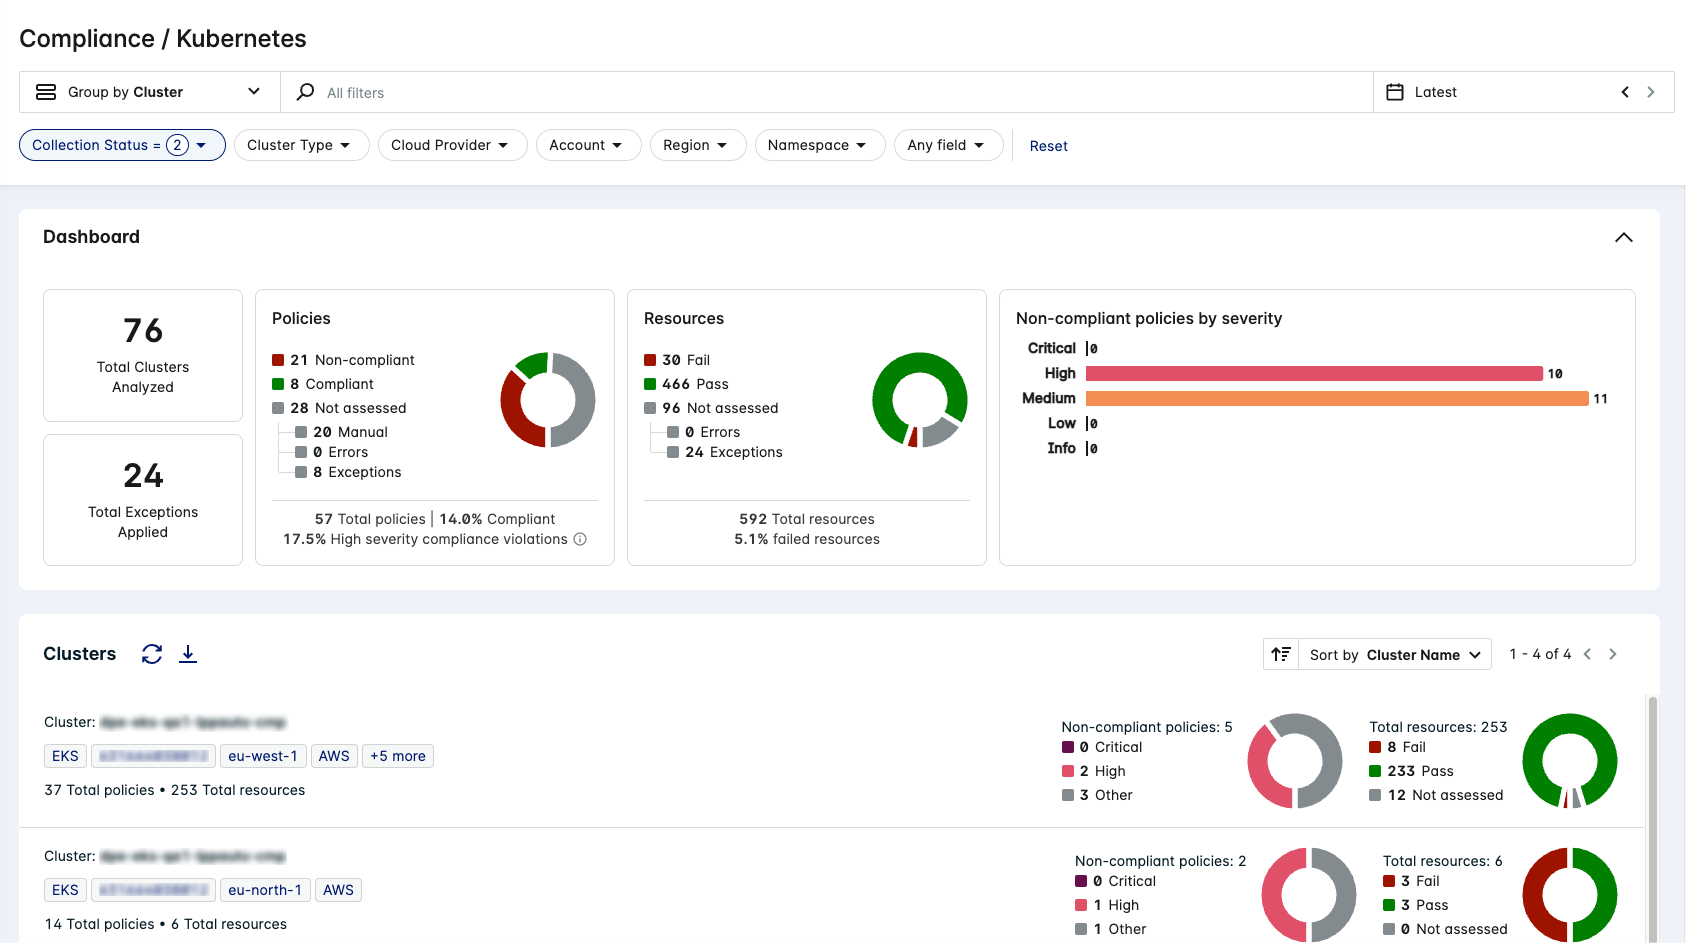
The Kubernetes Compliance dashboard contains a number of statistics and charts to help visualize your security posture.
important
All charts and statistics actively update to the group, search, and/or filters that you apply to the page.
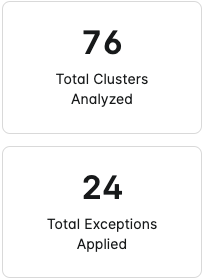
Statistics
The statistics display the total number of Kubernetes clusters analyzed, and the total number of exceptions applied across all Kubernetes Compliance policies.
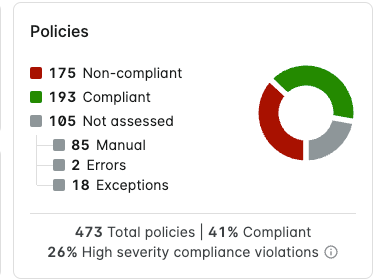
Policies
The Policies chart displays the total number of Kubernetes Compliance policies and splits them into the following categories:
- Policies that are non-compliant when integrated resources were assessed.
- Policies that are compliant when integrated resources were assessed.
- Policies that have not been assessed due to the following reasons:
- Policies require manual auditing.
- Policies were not assessed due to an error.
- Policies have exceptions applied to them.
It also displays what percentage of the total number of policies are compliant.
The High severity compliance violations statistic displays the percentage of critical and high severity policies that are non-compliant. This percentage is based off of the total number of policies.
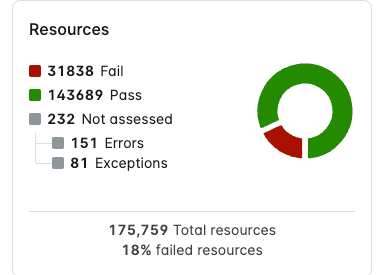
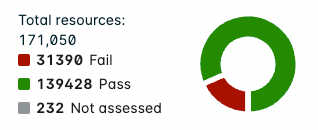
Resources
The Resources chart displays the total number of Kubernetes resources and splits them into the following categories:
- Resources that are non-compliant due to failing a policy assessment (or multiple policy assessments).
- Resources that are compliant due to passing policy assessments.
- Resources that have not been assessed due to the following reasons:
- Resources were not assessed due to an error.
- Resources have exceptions applied to them.
It also displays what percentage of the total number of resources have failed one or more policy assesssments.
Non-compliant policies by severity
This chart splits non-compliant Kubernetes Compliance policies into severity levels of Critical, High, Medium, Low, and Info.
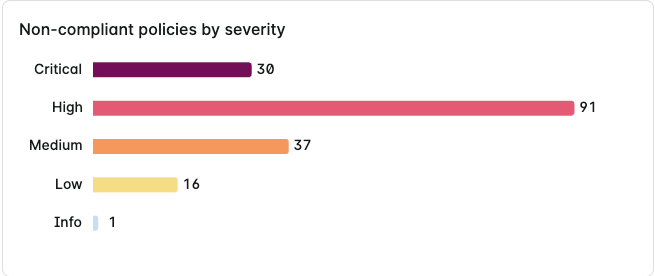
Hover over any of the bars to get the exact number of non-compliant policies for that severity.

Compliance List Charts
Each row in the Compliance list has a chart (or charts) associated to that policy, account, assessment, cluster, or section. The list displays different chart(s) depending on what group is selected.
Group by Policy Chart
When Group by Policy is selected, the chart displays the total number of resources linked with that policy and splits them into the following categories:
- Fail - Resources that are non-compliant due to failing the policy assessment.
- Pass - Resources that are compliant due to passing the policy assessment.
- Not assessed - Resources that have not been assessed due to errors or exceptions.

Policy Drawer Charts
When clicking on a policy in the Compliance list, the drawer displays the same chart with added statistics:
- Number of resources not assessed due to an error.
- Number of resources not assessed due to an exception.
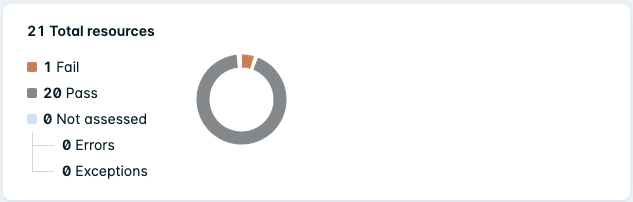
Additionally, the total number of exceptions applied to the policy is shown (as of the last reported date and time).
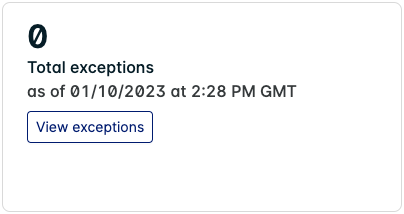
Click View exceptions to see details of any exceptions applied to the policy. You can also add new exceptions to the policy here.
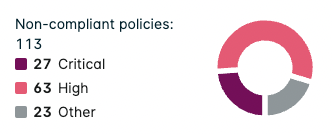
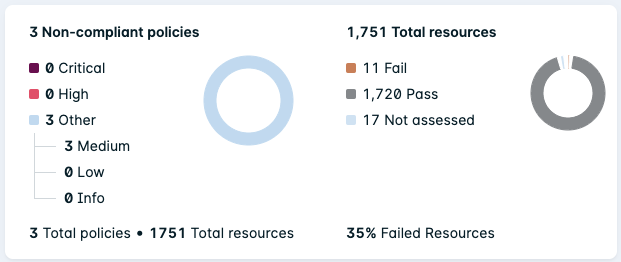
Group by Account/Assessment/Cluster/Section Charts
When Group by Account/Assessment/Cluster/Section is selected, the chart displays the total number of non-compliant policies for that assessment/service/account and splits them into severity levels of Critical, High, or Other (being Medium, Low, and Info combined).
Additionally, another chart displays the total number of resources linked with the policy and splits them into the following categories:
- Resources that are non-compliant due to failing the policy assessment.
- Resources that are compliant due to passing the policy assessment.
- Resources that have not been assessed due to errors or exceptions.
Account/Assessment/Cluster/Section Drawer Charts
When clicking on an account/assessment/cluster/section in the Compliance list, the drawer displays the same charts with added statistics:
- Total number of policies associated with the account/assessment/cluster/section.
- Total number of resources associated with the account/assessment/cluster/section.
- Percentage of resources that have failed one or more policy assessments.
Compliance List
The Compliance list is below the statistics and charts. Each row displays an individual policy, account, assessment, cluster, or section depending on what group is selected.
Use the icons show below to Refresh data and Download the table as a csv file:
![]()
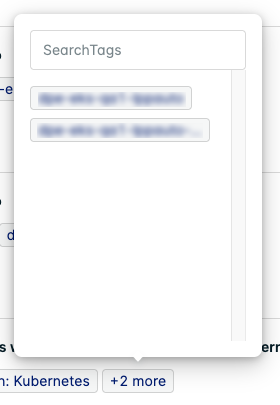
Click a tag link to reload the Compliance list with the tag as the filter. You can also search through remaining tags by clicking +N more (if it is available):
Group by Policy
When Group by Policy is selected, the Sort by options can order the list by:
- Policy Name
- Number of affected resources
- Level of Severity
Each row displays compliance details on an individual policy. For example, Minimize the admission of privileged containers.
Policy Drawer
Click on a policy row to display detailed results (expand this to full screen by using the < icon).
tip
For policies associated with a benchmark rule, click View Context (if available) underneath the policy title to see detailed information about the benchmark rule.
The policy drawer shows the most relevant tags (underneath the title) associated with the policy. The latest assessment time is also shown underneath the policy title.
Underneath the chart, the table displays assessment details for resources associated with the policy.
![]()
Click on the icons to refresh table data, download the table as a csv file, select columns, and search for specific text in any of the column details.
The table has the following information in each column:
| Column | Description |
|---|---|
| Account (hidden by default) | The cloud account associated with the resource. |
| Resource Name | The Kubernetes resource name being assessed under this policy assessment. |
| Resource Type | The type of Kubernetes resource. |
| Cluster | The Kubernetes cluster name associated with the resource. |
| Region (hidden by default) | If applicable, the cloud provider region of the resource. |
| Assessment | The status of the last policy assessment for the resource (for example: Compliant, Non-Compliant, Manual). |
Add Kubernetes Compliance Exceptions
- Click View exceptions to see details of any exception defined for this policy.
- Click Add exception and provide the exception criteria.
- Click Save once complete.
Group by Account
When Group by Account is selected, the Sort by options can order the list by:
- Account Name
- Number of affected resources
- Number of affected policies
Each row displays compliance details on an individual cloud account.
Account Drawer
Click on an account row to display detailed results (expand this to full screen by using the < icon).
The account drawer shows the most relevant tags (underneath the title) associated with the account (such as cluster names). The latest assessment time is also shown underneath the account name.
Underneath the chart, the table displays the number of resources that have passed or failed a particular policy assessment (found in this account).
![]()
Click on the icons to refresh table data, download the table as a csv file, select columns, and search for specific text in any of the column details.
The table has the following information in each column:
| Column | Description |
|---|---|
| Policy Name | The name of the policy. Click on the policy name to view the policy assessment with details on the failed (or compliant) resources. |
| Resources | The number of Kubernetes resources that have passed or failed this policy assessment. |
| Assessment | The status of the last policy assessment for all resources in this account (for example: Compliant, Non-Compliant, Manual). |
| Severity | The severity level of the policy. |
| Framework (hidden by default) | The report framework that the policy falls under. For example, if it is a CIS Amazon EKS 1.1.0 policy, the framework would be cis-eks-1-1-0. |
| Control (hidden by default) | If applicable, the CIS control ID for the policy (for example: 1.2). |
Group by Assessment
When Group by Assessment is selected, the Sort by options can order the list by:
- Assessment
- Number of affected resources
- Number of affected policies
Each row displays compliance details on an individual assessment report. For example, CIS EKS Benchmark v1.1.0.
Assessment Drawer
Click on an assessment row to display detailed results (expand this to full screen by using the < icon).
The assessment drawer shows the most relevant tags (underneath the title) associated with the assessment (such as regions). The latest assessment time is also shown underneath the assessment report name.
Underneath the chart, the table displays the number of resources that have passed or failed a particular policy assessment (found in this assessment report).
![]()
Click on the icons to refresh table data, download the table as a csv file, select columns, and search for specific text in any of the column details.
The table has the following information in each column:
| Column | Description |
|---|---|
| Policy Name | The name of the policy. Click on the policy name to view the policy assessment with details on the failed (or compliant) resources. |
| Resources | The number of Kubernetes resources that have passed or failed this policy assessment. |
| Assessment | The status of the last policy assessment for all resources covered in this assessment report (for example: Compliant, Non-Compliant, Manual). |
| Severity | The severity level of the policy. |
| Framework (hidden by default) | The report framework that the policy falls under. For example, if it is a CIS Amazon EKS 1.1.0 policy, the framework would be cis-eks-1-1-0. |
| Control (hidden by default) | If applicable, the CIS control ID for the policy (for example: 1.2). |
Group by Cluster
When Group by Cluster is selected, the Sort by options can order the list by:
- Cluster Name
- Number of affected policies
- Number of affected resources
Each row displays compliance details on an individual Kubernetes cluster.
Cluster Drawer
Click on a cluster row to display detailed results (expand this to full screen by using the < icon).
The cluster drawer shows the most relevant tags (underneath the title) associated with the cluster (such as account IDs). The latest assessment time is also shown underneath the cluster name.
Underneath the chart, the table displays the number of resources that have passed or failed a particular policy assessment (found on this cluster).
![]()
Click on the icons to refresh table data, download the table as a csv file, select columns, and search for specific text in any of the column details.
The table has the following information in each column:
| Column | Description |
|---|---|
| Policy Name | The name of the policy. Click on the policy name to view the policy assessment with details on the failed (or compliant) resources. |
| Resources | The number of Kubernetes resources that have passed or failed this policy assessment. |
| Assessment | The status of the last policy assessment for all resources on this cluster (for example: Compliant, Non-Compliant, Manual). |
| Severity | The severity level of the policy. |
| Framework (hidden by default) | The report framework that the policy falls under. For example, if it is a CIS Amazon EKS 1.1.0 policy, the framework would be cis-eks-1-1-0. |
| Control (hidden by default) | If applicable, the CIS control ID for the policy (for example: 1.2). |
Group by Section
When Group by Section is selected, the Sort by options can order the list by:
- Section
- Number of affected resources
- Number of affected policies
Each row displays compliance details on an individual section.
Section Drawer
Click on a section row to display detailed results (expand this to full screen by using the < icon).
The section drawer shows the most relevant tags (underneath the title) associated with the section (such as cluster names). The latest assessment time is also shown underneath the section name.
Underneath the chart, the table displays the number of resources that have passed or failed a particular policy assessment (found in this section).
![]()
Click on the icons to refresh table data, download the table as a csv file, select columns, and search for specific text in any of the column details.
The table has the following information in each column:
| Column | Description |
|---|---|
| Policy Name | The name of the policy. Click on the policy name to view the policy assessment with details on the failed (or compliant) resources. |
| Resources | The number of Kubernetes resources that have passed or failed this policy assessment. |
| Assessment | The status of the last policy assessment for all resources in this section (for example: Compliant, Non-Compliant, Manual). |
| Severity | The severity level of the policy. |
| Framework (hidden by default) | The report framework that the policy falls under. For example, if it is a CIS Amazon EKS 1.1.0 policy, the framework would be cis-eks-1-1-0. |
| Control (hidden by default) | If applicable, the CIS control ID for the policy (for example: 1.2). |
Determination of the Could Not Assess Status
In order to assess resources for compliance, Lacework must collect data for each resource. Lacework uses the data collection status to determine which policies have a sufficient amount of quality information to be evaluated, even if there is only information for some of the resources. An issue collecting data could cause the status to be returned as Could not assess.
Some issues that Lacework could encounter when collecting data include the following:
- Transient failures, for example: rate limits and timeouts.
- Incorrect permissions used by the Lacework collector.
The assessability functionality converts a recognition of the many potential problems into the Could not assess result.
Lacework applies the following process to determine if a policy’s status is Could not assess:
- At a resource level:
- If Lacework can determine non-compliance, then the resource is “non-compliant”.
- Else, if Lacework cannot determine non-compliance, and the resource was not successfully fully collected, the resource is Could not assess.
- Else, (Lacework can determine that there is no non-compliance, or sufficient conditions for compliance) the resource is “compliant”.
- Lacework aggregates resource-level compliance observations and determines the aggregate status for the cloud integration as follows:
- Non-compliant if any resources are known to be non-compliant
- Could not assess if no resources are non-compliant, but some resource evaluations were Could not assess
- Compliant if all resources are known to be compliant
The overall goal of Lacework is to never report a resource as compliant if it is not. Policy queries need adequately reliable information to determine non-compliance, and the methodology used is biased towards determining non-compliance, not compliance. It is possible for Lacework to determine a collection to be Could not assess and a policy using that collection in some way to be non-compliant. The granularity of assessment capability will be refined in later releases.