Kubernetes
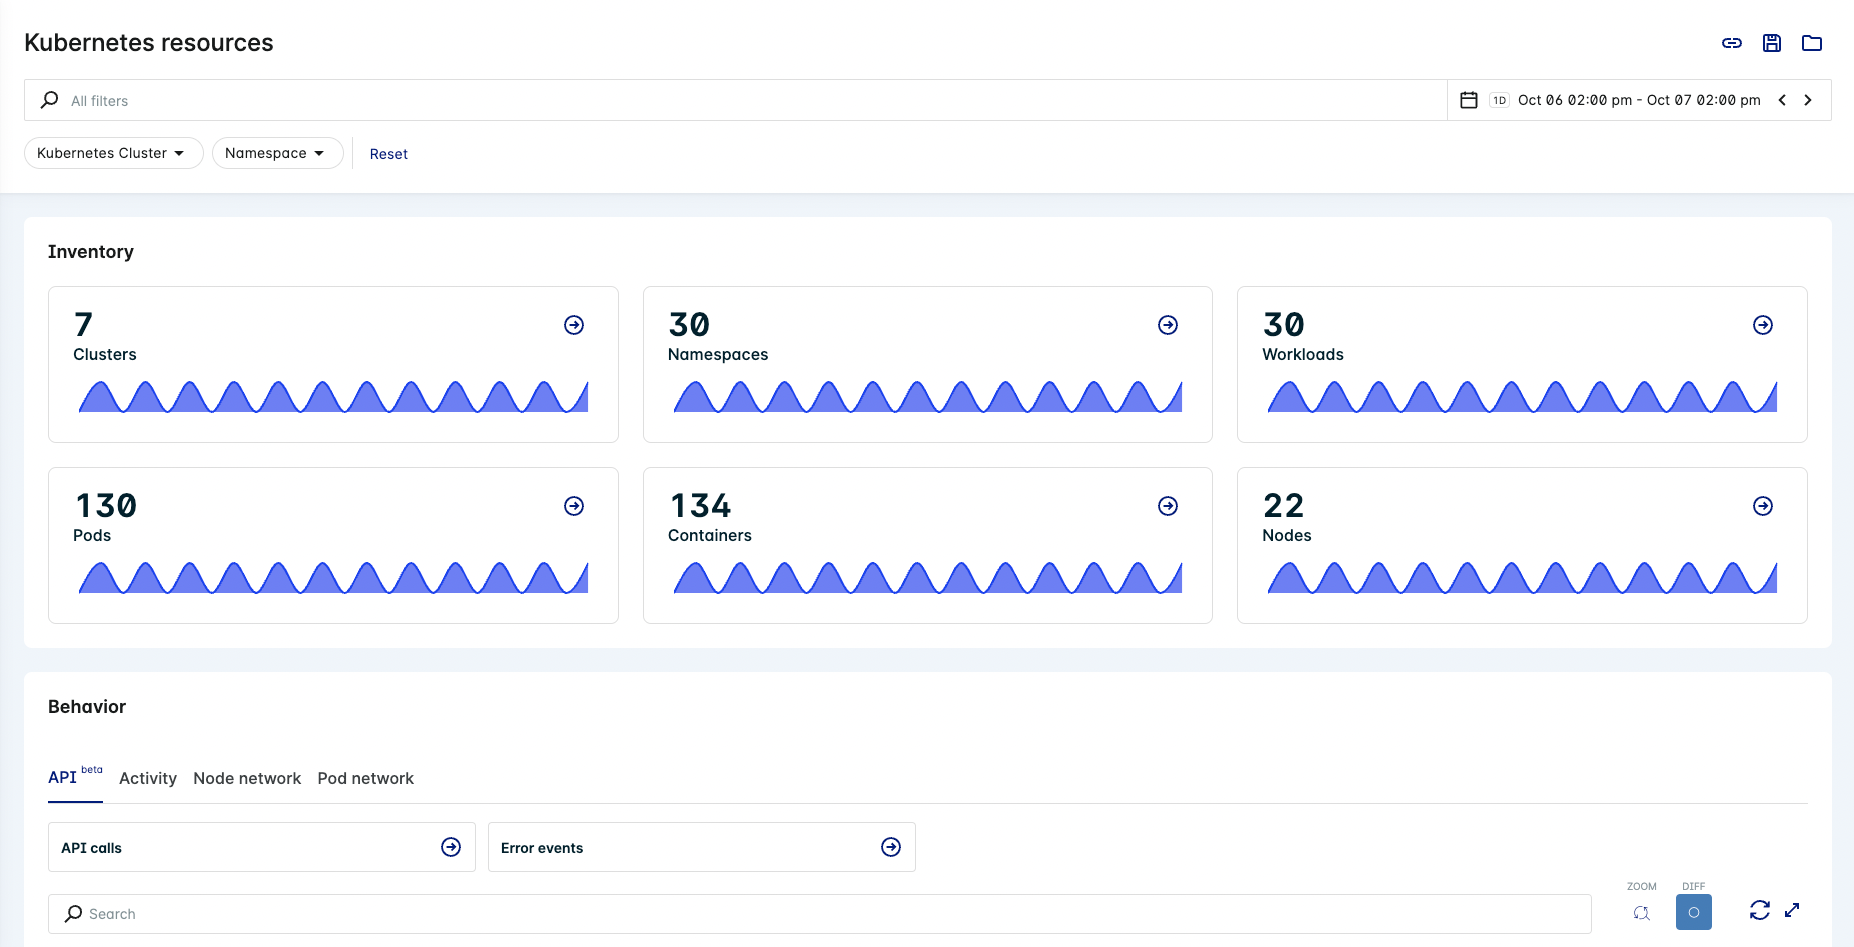
The Kubernetes dossier displays information from multiple name spaces and clusters. To access the Kubernetes dossier, select Resources > Kubernetes in the Lacework Console.
To populate the data available in this dossier, you must install both parts of the Lacework agent:
- A YAML file with configuration information is installed on the cluster
- An agent that transmits information to Lacework is installed on each node in the cluster

Filters
By default, the page displays all Kubernetes pods from the past day. Use the following methods to refine the list of displayed resources:
- Use the search function at the top of the page to find specific text in any of the details available on the page. You can also click the search field to select values and operators to narrow your search.
- Click the filter dropdowns along the top of the page, check the boxes, and click Show results to make them active. Click an active filter to remove it or click Reset.
Time Range
To change the time period, select one from the drop-down or use the horizontal arrows to move to the next/previous period. Select from the following past periods: latest day, 3 days, week, month, or a custom range.
Only information found during the specified date range is reported. For example, if 9 days ago there was specific behavior on a pod and the specified date range is 7 days, this behavior is not listed in the table.
Save View
When the page displays your required resources, you can click the Save view icon in the top right corner to save the current view. This lets you access the saved view later through the Open view icon.
When you open a saved view, its name displays in the page title as Resources/Kubernetes/view name. Click the icon adjacent to this name to access additional actions such as duplicate and delete.
To copy the link to the current view, click the Copy link icon. You can then share that link with others so they can see the same view. Note that searches and sorting cannot be saved in views or copied as links.
Charts
Hover over a chart to see specific information for the cursor's position.

Hover over a chart's KPI box to see the data's effective time range.

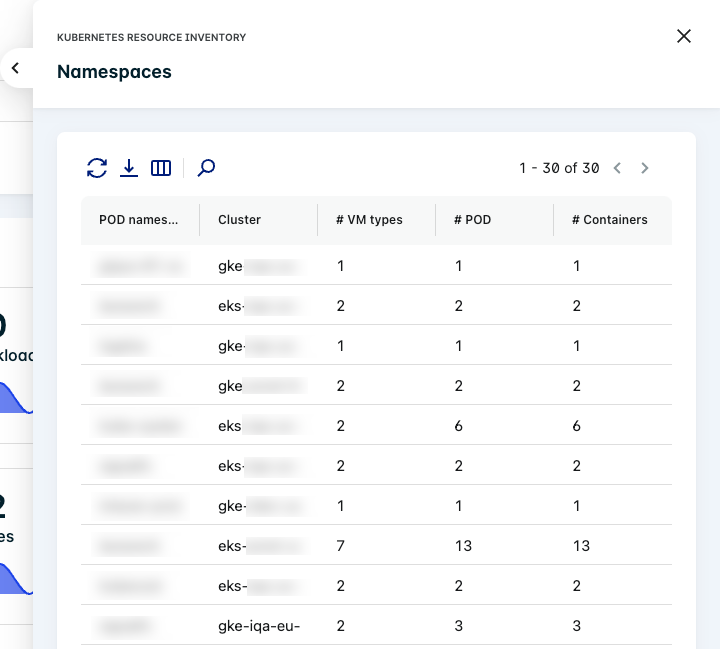
Click a chart's KPI box to expand a pane that contains relevant information in tabular format.

Inventory
This section includes the following charts:
- Clusters
- Namespaces
- Workloads
- Pods
- Containers
- Nodes

Behavior
See Kubernetes Activities Polygraph.
Health
This section includes the following charts:
- Memory Usage
- CPU Usage
- External In Bytes
- External Out Bytes

Related Events
This section includes a chart for each event severity.

View Kubernetes Activity Events
When there is an event and it meets the filter criteria that you specify, you should see an event on the Events page.
Click Details to view more information about the event.
FAQs
Why don't I see API events in the Polygraph?
After creating the EKS Audit Log cloud integration, you must add EKS clusters to the cloud integration (see step 2 using CloudFormation or the AWS CLI. It can take up to 5 hours to see events in the Polygraph and the API Calls table.
What events aren't shown in the Polygraph and table?
The EKS Audit Log policy does not provide logs for the "delete events" action.
Kubernetes Cluster Name
For information about how Lacework collects the cluster name from tags, see How Lacework Derives the Kubernetes Cluster Name.