View the Lacework Polygraph
Overview
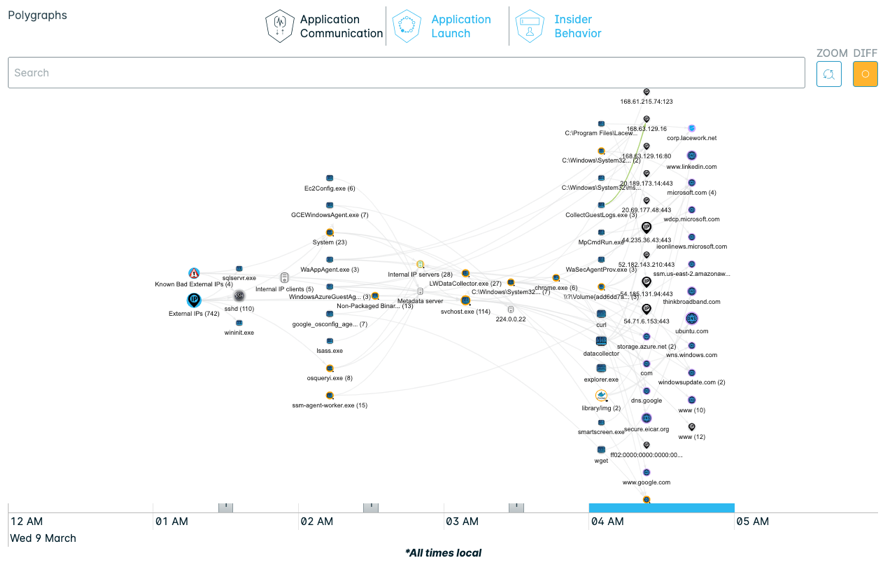
The Lacework polygraph detects anomalies, generates appropriate alerts, and provides a tool for users to investigate and triage issues.
Use the polygraph to:
- Monitor your Windows workload.
- Spot configurations that violate compliance.
- See security gaps and changes that could put your company at risk.
The polygraph technology dynamically develops a behavioral model of your services and infrastructure. The model understands natural hierarchies including processes and machines. It then develops behavioral models that the polygraph monitors for activities that fall outside the model’s parameters. In addition, the polygraph continually updates its models to:
- Pinpoint exactly how a file changes.
- Investigate anomalous events and activities related to FIM signals.
- Provide cloud-wide capabilities for search, file type summaries, and detection of new files.
View the Polygraph
In the Lacework Console, go to Resources > Hosts and select a dossier to examine.
Scroll down to view the Lacework polygraph.

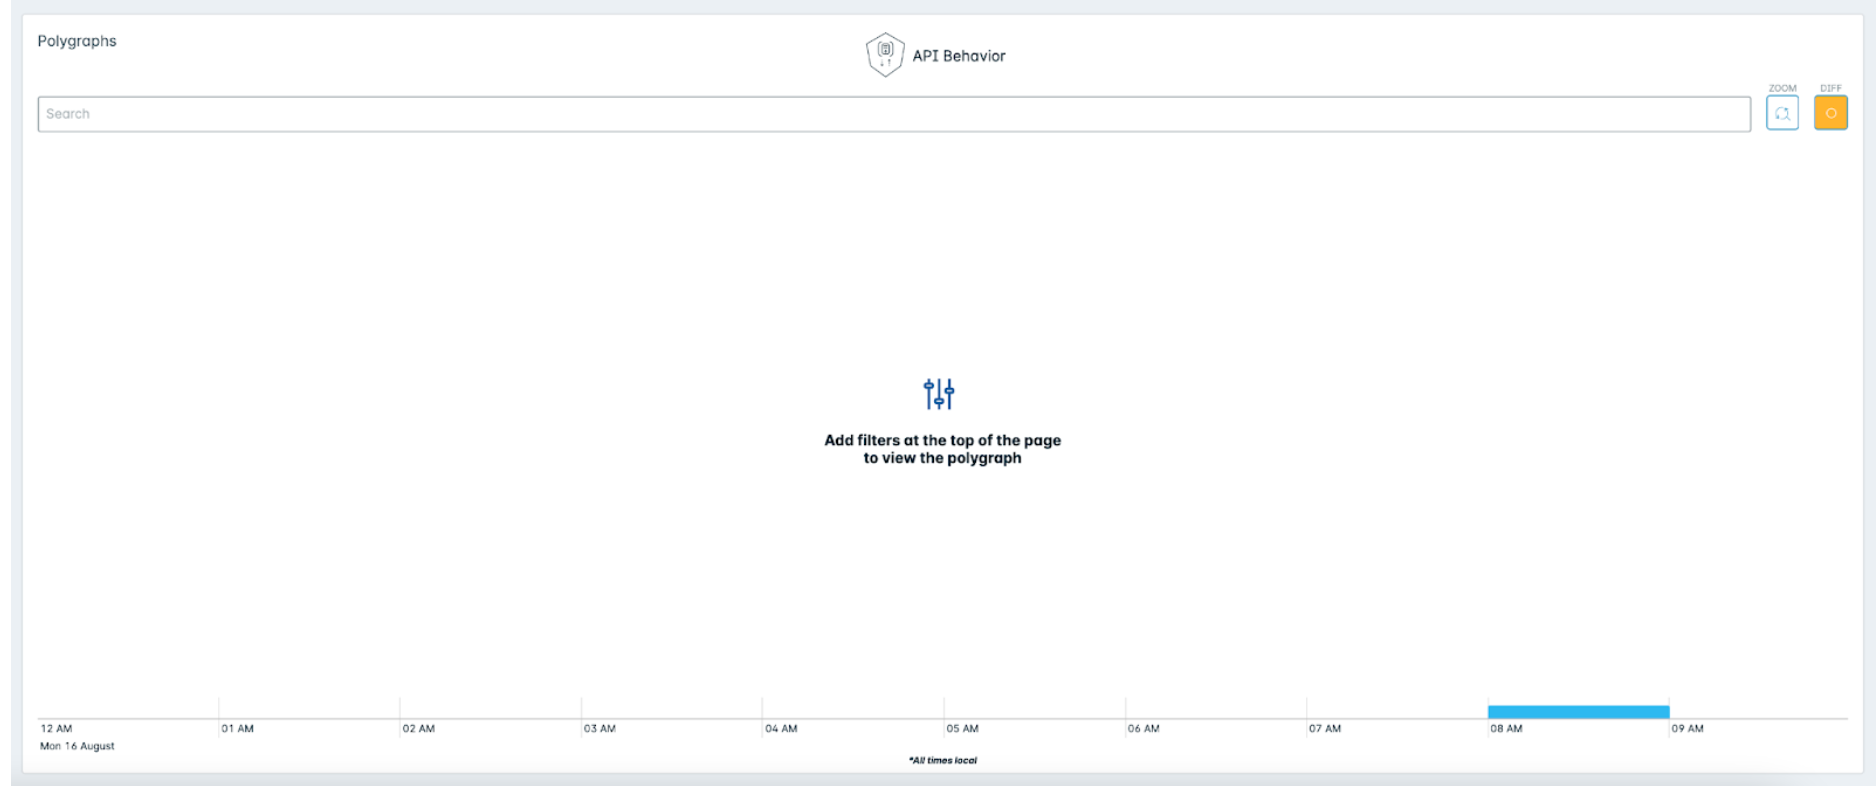
If the number of clustered nodes is greater than 3000, then the polygraph does not appear. Instead, the following message appears:
Add filters at the top of the page to view the polygraph.

To view the polygraph, you should add filters in the filter field at the top of the page.