Kubernetes Audit Logs Overview
All Kubernetes activities, whether manual with the kubectl tool, or automated, result in one or more API calls to the Kubernetes API server. Kubernetes can be configured with an audit log policy to record some or all of these API calls and associated metadata.
Lacework can ingest these logs to monitor user activities (e.g. kubectl exec and port-forward), the deployment of new resources such as workloads, Kubernetes roles and role bindings, and the deletion of resources, authentication issues, and forbidden API calls, for example.
The Polygraph Data Platform can ingest millions of logs and surface the most important events, such as the execution of rogue containers, the deployment of misconfigured workloads, the addition of dangerous roles, and manual logins to containers. Lacework provides anomaly detection and the option to run custom policies tailored to your special use cases.
Polygraph for Kubernetes Audit Logs
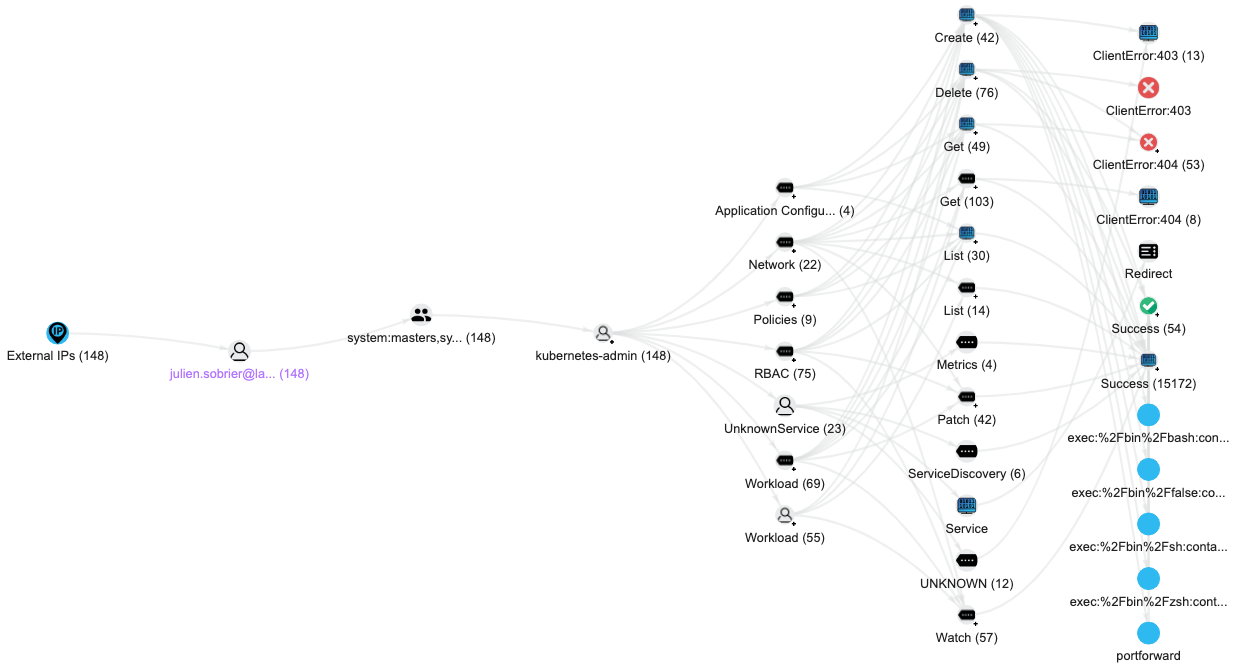
All observed events are visualized through the Lacework Polygraph, for example, the creation of resources, including Kubernetes workloads and RBAC, the deletion of resources, and other events. The Polygraph shows the different element of a Kubernetes API call, from left to right:
- Source IP address: Internal IP or external IP
- Kubernetes group(s) of the user initiating the API call
- AWS username (when available) initiating the API call
- Kubernetes username initiating the API call
- Kubernetes user impersonated (when available)
- Type of resource targeted: Workload (daemonset, deployment, pod), RBAC (roles or bindings), Storage (persistent volumes or CSI drivers).
- Action: CreateJob, PatchPod, or DeleteNamespace.
- Status of the API call: Success (200 OK) or Failure
Polygraph Search
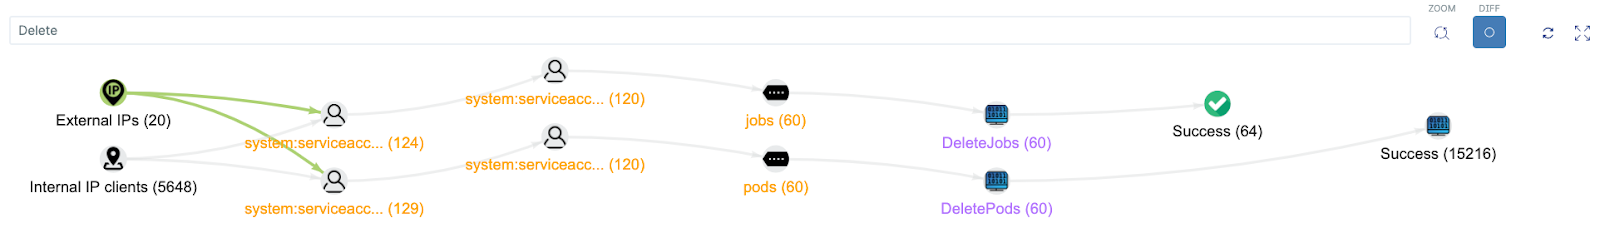
You can search the Polygraph for multiple terms including specific actions, namespace names, and resource names. The following is an example search for the delete action. It shows users successfully connecting through external and internal IPs, and deleting 60 jobs and the corresponding 60 pods:
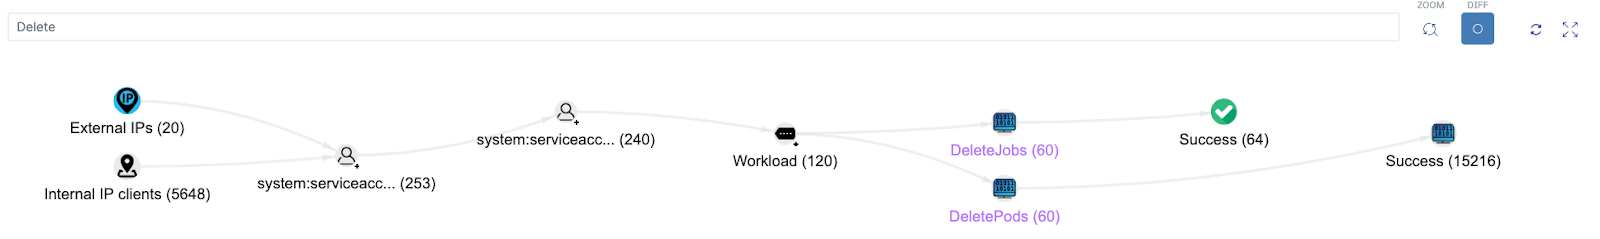
Hover each node to get additional information such as the list of IPs and the list of Kubernetes groups. Some nodes have a + sign next to them. Click and hold the + icon to expand these nodes.
API Calls and Error Events
You can visualize audit logs in two tables:
- API Calls - The table lists all interesting audit logs. Lacework filters out some internal Kubernetes activities, such as leases updates, to focus on more interesting logs.
- Error Events - API calls that resulted in an error.
Similar to the Polygraph search, you can search logs for any available fields. A search for delete shows the 120 logs that appeared in the Polygraph search, 60 logs for deleting jobs and 60 logs for deleting pods. You can find additional information such as resource details, the exact time of the event, or the user agent.
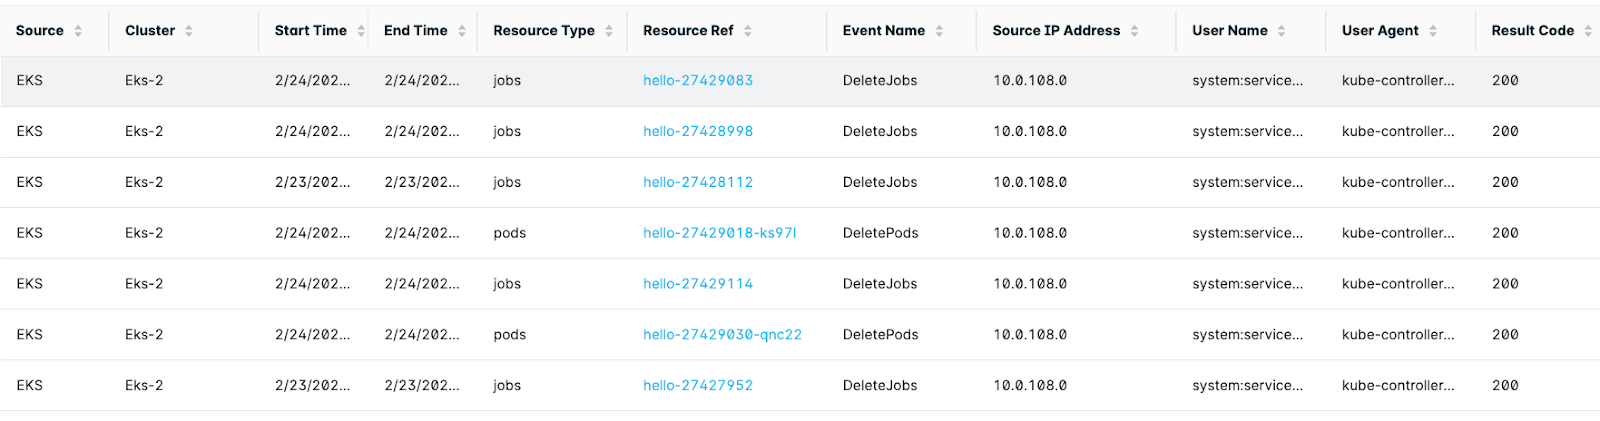
You can customize the displayed columns; some are hidden by default.
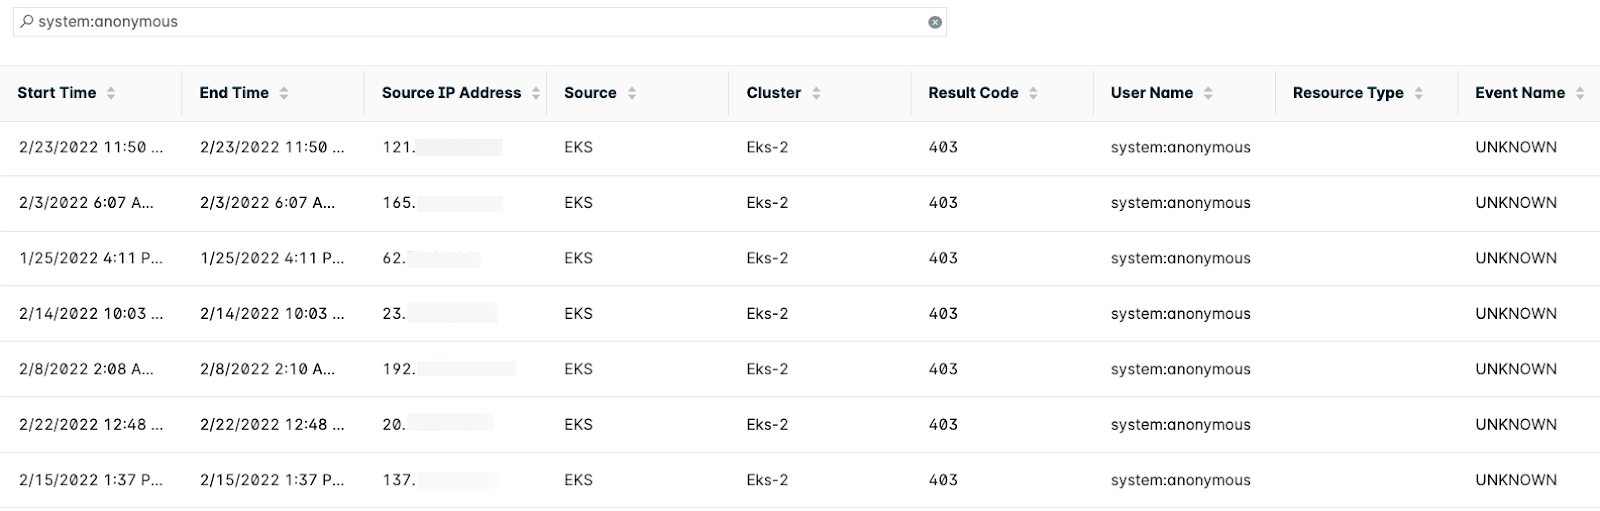
The Error Events table shows all API calls that resulted in an error due to issues such as authentication issues or wrong permissions. If the Kubernetes API server is open to the internet, there may be a lot of API calls from unauthenticated users (systemt:anonymous Kubernetes users) probing the API server. Most HTTP calls are random requests from public IPs that result in an invalid API call.
Anomaly Detection for Kubernetes Audit Logs
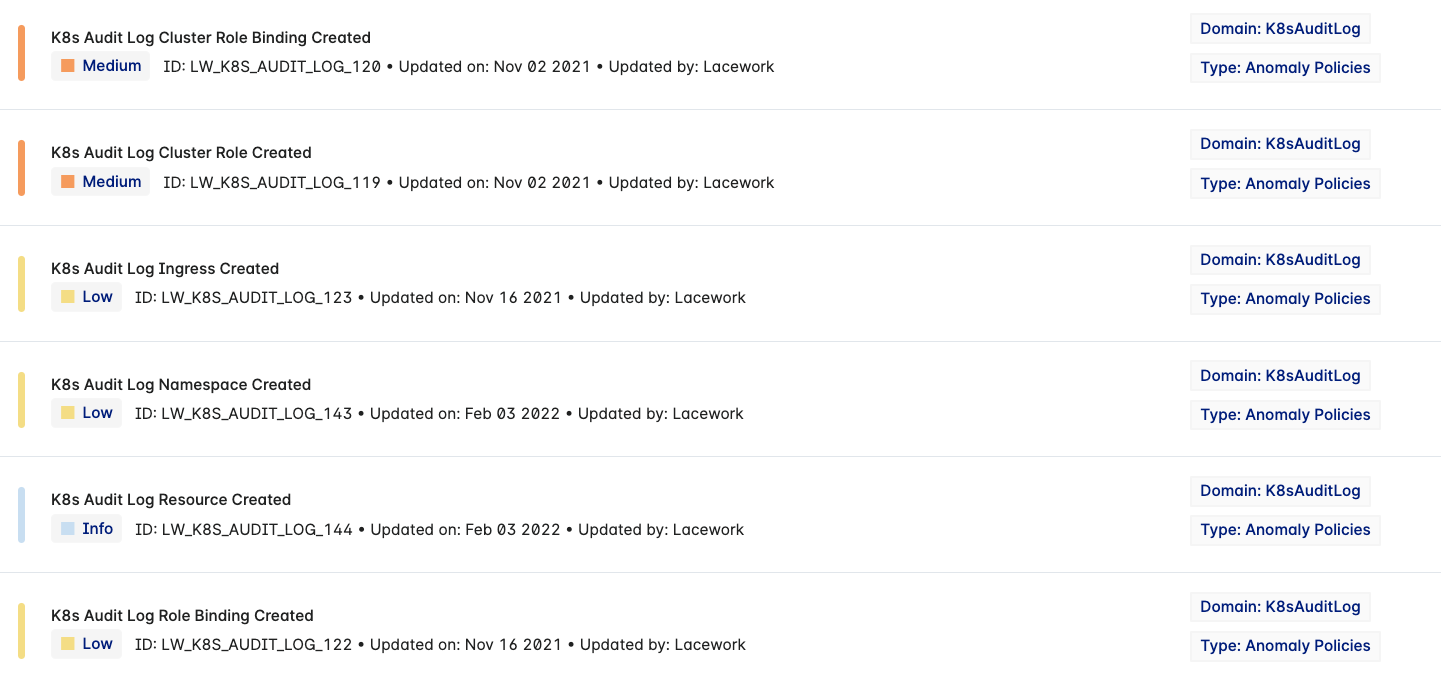
The Platform continuously monitors the audit logs to detect abnormal behaviors, such as new workloads, container registries used for the first time, and overly permissive new roles and cluster roles. You can view the list of anomalies on the Policies page with the K8sAuditLog filter.
You can customize each anomaly to include or exclude information such as namespaces or clusters.
Anomalies look at new events across all clusters for the last 90 days. For example, the anomaly looking for a new workload will trigger only one event if the same workload is deployed multiple times in different clusters or if it is deployed in a different namespace.
You can view the list of Kubernetes behavior anomaly policies on the Default Policies page.
Policies for Kubernetes Audit Logs
The Default Policies page lists Kubernetes policies that Lacework uses to detect anomalies. Anomalies detect and notify you of new events that have never been seen in the past 90 days, whereas policies alert on every single occurrence of an event. You can use the Kubernetes policies to track information such as workloads being deployed or roles being created.
Example: kubectl exec
Lacework can detect the kubectl exec command that allows a user to log in remotely to a Kubernetes container. These commands exist in the following sections:
- Polygraph
- API Calls table
- List of events related to Kubernetes Audit Logs
Polygraph
In the Polygraph search box, type exec. This narrows the Polygraph to any element that contains exec, including the exec action. If you have resources (e.g. workloads or roles) that include exec in the name, you can filter them out by adding the corresponding -pod or -role to the search.
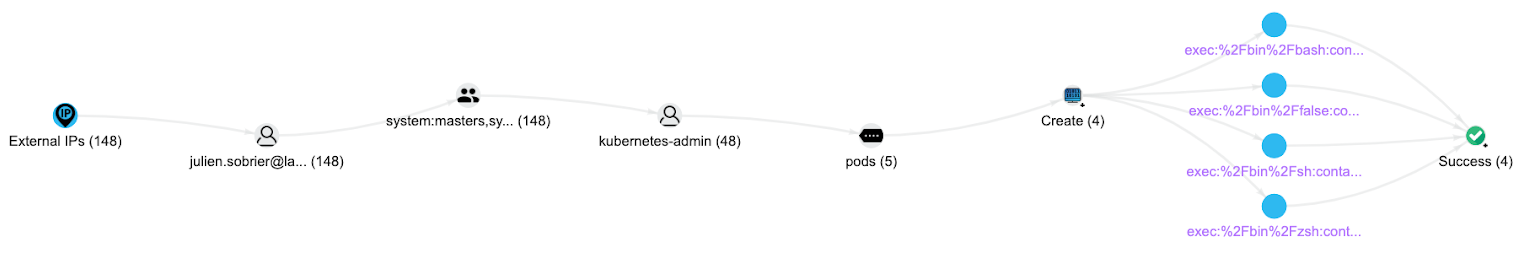
This example shows that the user julien.sobrier@lacework.net (hover over the user to get full information) ran kubectl exec four times. You can hover each exec code to see the full command executed in the container.
For more information regarding the user's actions, change the search term to their surname. In the example, the user ran a kubectl port-forward command and a couple of API calls that failed. You can expand the different nodes for additional information.
API Calls
For additional information regarding the kubectl exec commands, open the API Calls table. Search for exec. In addition to the exec command, you can find related API calls such as the creation of a role or ClusterRole with pod/exec privilege (CreateRoles_WithPodExec).
The events of interest are CreatePods events on the pods Resource Type with the 101 Result Code.
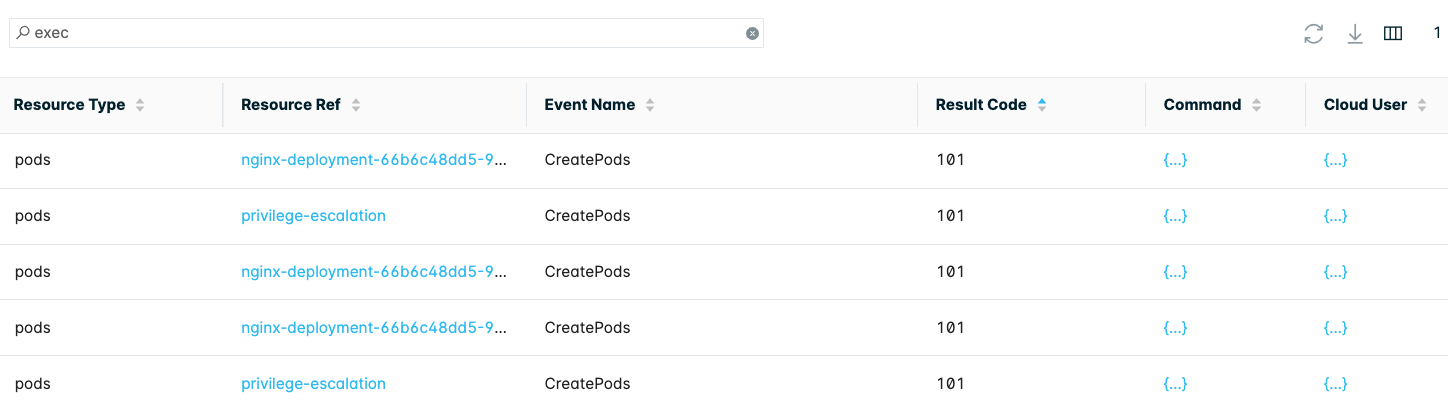
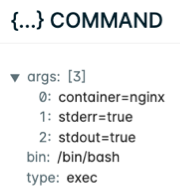
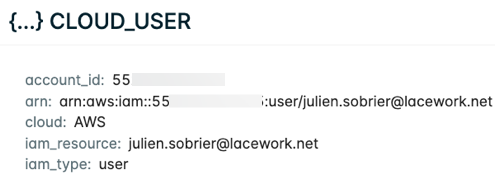
Click {...} under the Command column for command run details. Click {...} under Cloud User to view who ran the exec command:
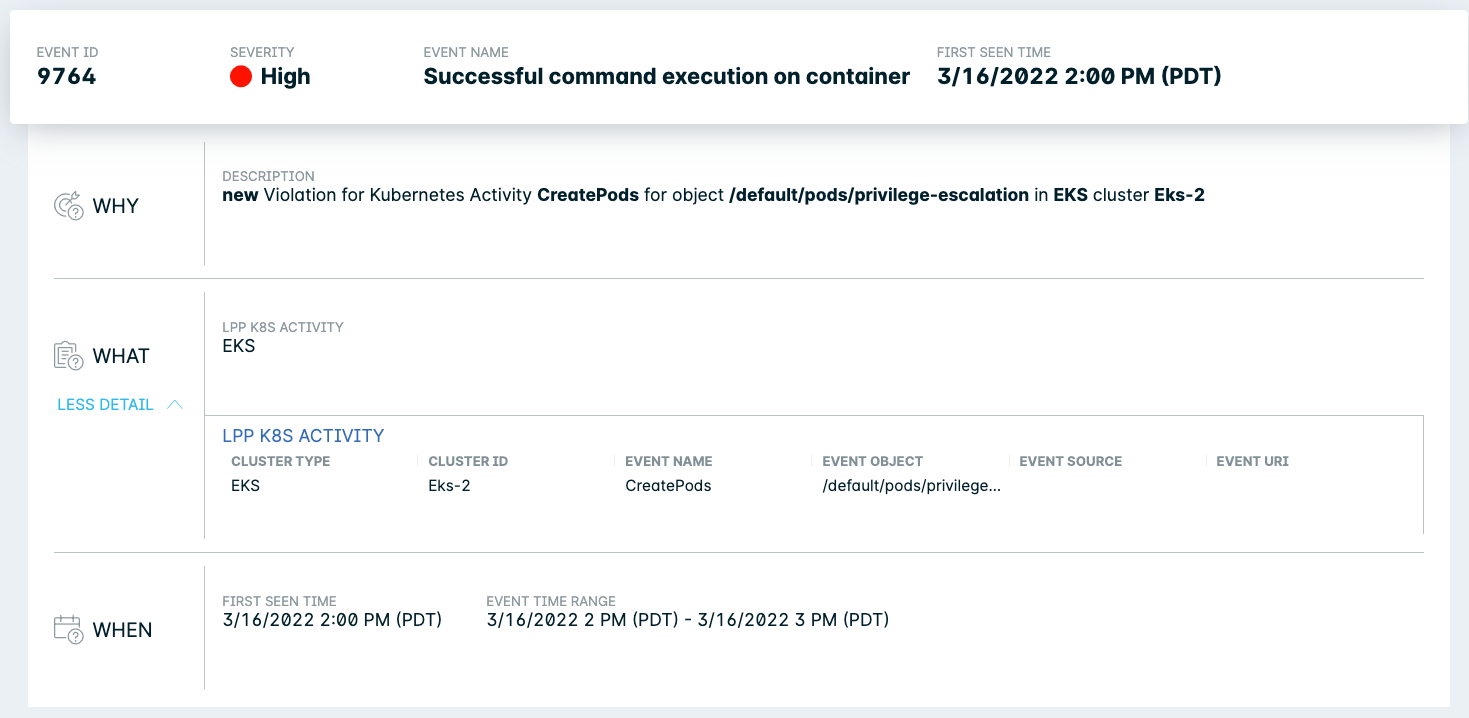
Kubernetes Alerts
To view the Lacework default policies for Kubernetes, go to the Policies page and click the Kubernetes filter. For anomalies, click the K8sAuditLog filter instead. For example, one Kubernetes policy looks for successful kubectl exec commands. This policy triggers a new event for every exec command ran by the specified user.